Lima, Peru: Backdraft

December 24th, 2010

I recently traveled to Peru to deliver a presentation on 3D Firefighting at the First International Congress on Emergency First Response which was conducted by the Cuerpo General de Bomberos Voluntarios del Perú. This congress was being conducted in conjunction with the Peruvian fire service’s 150th anniversary celebration (establishment of Unión Chalaca No. 1, the first fire company).

In addition to my conference presentation, I spent 10 days teaching fire behavior and working alongside the Bomberos of Lima No.4, San Isidro No. 100, and Salvadora Lima No. 10.

Fire & Rescue Services in Lima, Peru

Lima is a city of 8 million people served by a volunteer fire service which provides fire protection, emergency medical services, hazmat response, and urban search and rescue. The stations that I worked in were busy with call volumes from 2000 to 5000 responses in an urban environment ranging from modern high-rise buildings to poor inner city neighborhoods. Each station was equipped with an engine, truck, rescue, and ambulance. Staffing varied throughout the day with some units being cross staffed or un-staffed due to limited staffing. At other times, units were fully staffed (5-6 on engines and trucks, 4 on rescues, and 3 on ambulances). While the Peruvian fire service has some new apparatus, many apparatus are old and suffer from frequent mechanical breakdown. Faced with high call volume and old apparatus and equipment, the Firefighters and Officers displayed a tremendous commitment to serve their community.

The firefighters I encountered had a tremendous thirst for knowledge and commitment to learning. My friend Giancarlo had arranged for a short presentation on fire behavior for a Tuesday evening and the room was packed. Class was scheduled from 20:00 until 22:00. However, when we reached 22:00, the firefighters wanted to stay and continue class. We adjourned at 24:00. This continued for the next two nights. Sunday, between calls, we had breakfast at San Isidro No. 100 and then conducted a hands-on training session on nozzle techniques and hose handling. At the start of class, Firefighter Adryam Zamora from Santiago Apostol No. 134, related that he used the 3D techniques we had discussed in class at an apartment fire the night before with great success.

Staff Ride

Staff rides began with the Prussian Army in the mid-1800s and are used extensively by the US Army and the US Marine Corps. A staff ride consists of systematic preliminary study of a selected campaign or battle, an extensive visit to the actual sites associated with that campaign, and an opportunity to integrate the lessons derived from these elements. The intent of a staff ride is to put participants in the shoes of the decision makers on a historical incident in order to learn for the future. Wildland firefighters have adapted the staff ride concept and have used it extensively to study large wildland fires, fatalities, and near miss incidents. However, structural firefighters have not as commonly used this approach to learning from the past.

When I traveled to Lima, I only knew two Peruvians; Teniente Brigadier CBP (a rank similar to Battalion Chief in the US fire service) Giancarlo Passalaqua and Teniente CBP (Lieutenant) Daniel Bacigalupo. However, I left Lima with a much larger family with many more brothers and sisters.

Backdraft!

Many firefighters have seen the following video of an extreme fire behavior event that occurred in Lima, Peru. This video clip often creates considerable discussion regarding the type of fire behavior event involved and exactly how this might have occurred. Photos and video of fire behavior are a useful tool in developing your understanding and developing skill in reading the fire. However, they generally provide a limited view of the structure, fire conditions, and incident operations.

Note: While not specified in the narrative, this video is comprised of segments from various points from fairly early in the incident (see Figure 3, to later in the incident immediately before, during, and after the backdraft).

When I was invited to Lima, I asked my friend Teniente Brigadier CBP Giancarlo Passalaqua who worked at this incident, if it would be possible to talk to other firefighters who were there and to walk the ground around the building to gain additional insight into this incident.

The Rest of the Story

The morning after I arrived, I was sitting in the kitchen of San Isidro No. 100 and was joined in a cup of coffee by Oscar Ruiz, a friendly and engaging man in civilian clothing who I assumed was a volunteer firefighter at the station. After my friend Giancarlo arrived, he told me that Oscar was actually Brigadier CBP (Deputy Chief) Oscar Ruiz from Lima No. 4 and one of the two firefighters who had been in the bucket of the Snorkel pictured in the video. Oscar and I had several opportunities to spend time together over the course of my visit and he shared several observations and insights into this incident.

At 11:00 hours on Saturday, March 15, 1997, two engines, a ladder, heavy rescue, medic unit, and command officer from the Lima Fire Department were dispatched to a reported commercial fire at the intersection of Luis Giribaldi Street and 28 de Julio Street in the Victoria section of Lima.

Companies arrived to find a well developed fire on Floor 2 of a 42 m x 59 m (138’ x 194’) three-story, fire resistive commercial building, The structure contained multiple, commercial occupancies on Side A (Luis Giribaldi Street) and Side B (28 De Julio Street). Floors 2 and 3 were used as a warehouse for fabric (not as a plastics factory as reported in the video clip). The building was irregularly shaped with attached exposures on Sides B and C.

Exposure A was a complex of single-story commercial occupancies, Exposure B was an attached two-story commercial complex, Exposure C was an attached three story commercial complex, and Exposure D was a three story apartment building. All of the exposures were of fire resistive construction.

Figure 1. Plot Plan
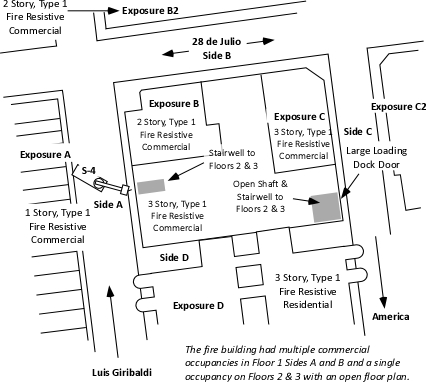
Floors 2 and 3 had an open floor plan and were used for storage of a large amount of fabric and other materials. As illustrated in Figure 1, there were two means of access to Floors 2 and 3; a stairway on Side A and an open shaft and stairway on Side C.

Due to heavy fire involvement, operations focused on a predominantly defensive strategy to control the fire in this multi-occupancy commercial building. The incident commander called for a second, and then third alarm. Defensive operations involved use of handlines and an aerial ladder working from Side A and in the Side A stairwell leading to Floor 2. However, application of water from the ladder pipe had limited effect (possibly because of the depth of the building and burning contents shielded from direct application from the elevated stream.

Figure 2. Early Defensive Operations
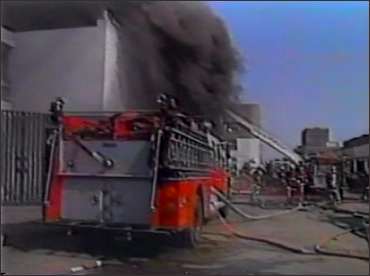
Note: Video screen shot from the intersection of Luis Giribaldi and 28 de Julio.

The third alarm at 14:05 hours brought two engines and articulating boom aerial platform (Snorkel) from Lima 4 to the incident. Snorkel 4, under the command of Captain Roberto Reyna was tasked to replace the aerial ladder which had been operating on Side A and operate an elevated master stream to control the fire on Floor 2 (Figure 2).

Placing their master stream into operation Teniente Oscar Ruiz and Captain Roberto Reyna worked to darken the fire on Floor 2. As exterior streams were having limited effect, Snorkel 4 was ordered to discontinue operation and began to lower the bucket to the ground. At the same time, efforts were underway to gain access to the building from Side C. Using forcible entry tools, firefighters breached the large loading dock door leading to the vertical shaft and stairwell in the C/D quadrant of the building.

Prior to opening the large loading dock door on Side C (Charlie/Delta Corner), a predominantly bi-directional air track is visible at ventilation openings on Side C. Flaming combustion from windows on Side A was likely limited to the area at openings with a bidirectional air track. Combustion at openings on Side A likely consumed the available atmospheric oxygen, maintaining extremely ventilation controlled conditions with a high concentration of gas phase fuel from pyrolyzing synthetic fabrics deeper in the building.

The ventilation profile when Snorkel 4 initially began operations included intake of air through the open interior stairwell (inward air track) serving floors 1-3 and from the lower area of windows which were also serving as exhaust openings (bi-directional air track). Interview of members operating at the incident indicates that there were few if any ventilation openings (inlet or exhaust) on Sides B, C, or D prior to creation of an access opening on Floor 1 Side C.

At approximately 15:50, Snorkel 4 was ordered to stop flowing water. As smoke conditions worsened, they did so and began to lower the aerial tower to the ground. At the same time, crews working to gain access to Floor 1 on Side C, breached the large loading dock door. A strong air track developed, with air rushing in the large opening and up the open vertical shaft leading to the upper floors as illustrated in Figure 3.

Figure 3. Layout of Floors 1 and 2

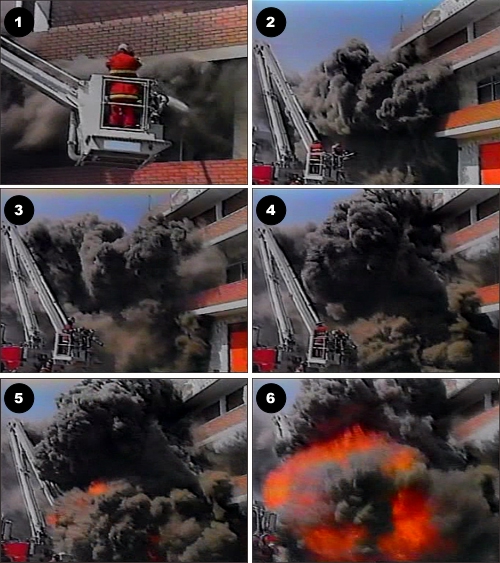
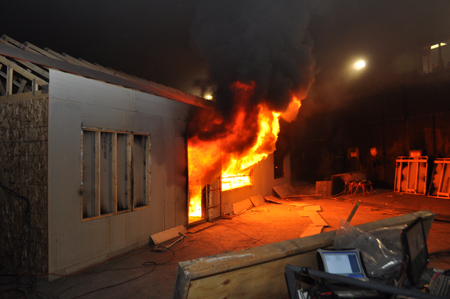
As the Snorkel was lowered to the ground, Teniente Oscar Ruiz observed a change in smoke conditions, observing a color change from gray/black to “phosphorescent yellow” (yellowish smoke can also be observed in the video clip of this incident). Less than two minutes after the change in ventilation profile, a violent backdraft occurred, producing a large fireball that engulfed Captain Roberto Reyna and Teniente Oscar Ruiz in Snorkel 4 (see Figure 4). The blast seriously injured the crew of Snorkel 4 along with numerous other members from stations Lima 4, Salvadora Lima 10, and Victoria 8 who were located in the Stairwell (these members were blown from the building) and on the exterior of Side A.

This incident eventually progressed to a fifth alarm with 63 companies from 26 of Lima’s 58 stations in attendance.

Figure 4. Backdraft Sequence

Watch the video again; keeping in mind the changes in air track that resulted from breaching the loading dock door on Side C. Consider the B-SAHF (Building, Smoke, Air Track, Heat, and Flame) indicators that are present as the video progresses.

Luis Giribaldi Street and 28 de Julio Street Today

The building involved in this incident is still standing and while it has been renovated, is much the same as it was in 1997. On December 6, 2010, Teniente Brigadier Giancarlo Passalaqua, myself and Capitáin Jordano Martinez went to Luis Giribaldi and 28 de Julio to walk the ground and gain some insight into this significant incident.

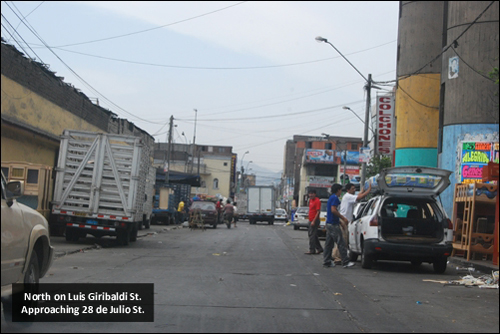
Figure 5. Luis Giribaldi Street

As illustrated in Figure 5, Luis Giribaldi Street is a one-way street with parking on both sides and overhead electrical utility lines.

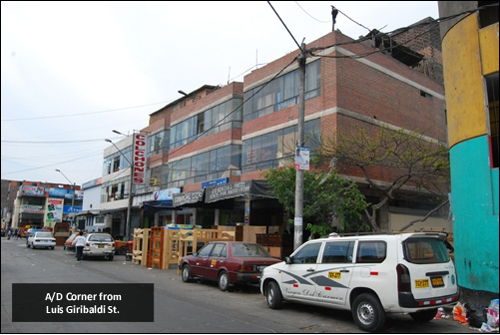
Figure 6. A/D Corner

There are a number of obvious structural changes that have been made since the fire. Including installation of window glazing flush with the surface of the building (the original windows can be seen behind these outer windows).

Figure 7. Snorkel 4’s Position

Figure 7 shows the view from Snorkel 4’s position, just to the left of center is the entry way leading to the stairwell used to access Floors 2 and 3. Piled fabric and other materials can be seen through the windows of Floors 2 and 3, likely similar in nature to conditions at the time of the incident.

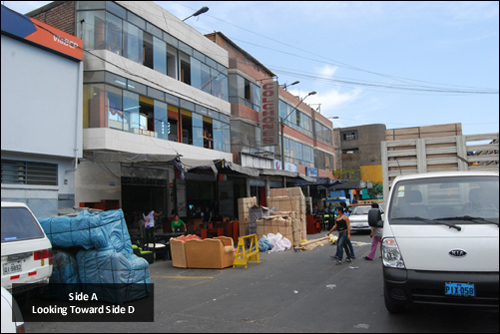
Figure 8. Side A

Figure 8 provides a view of Side A and Exposure B, which appears to be of newer construction and having a different roofline than the fire building. The appearance of the left and right sides of the fire building are different, but this is simply due to differences in masonry veneer on the exterior of the building.

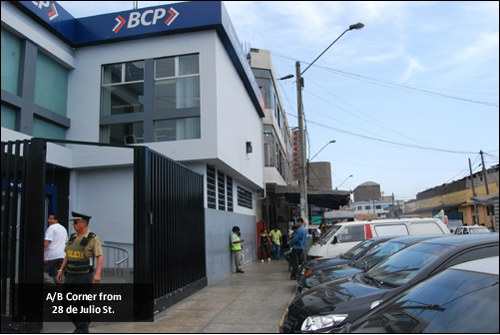
Figure 9. A/B Corner

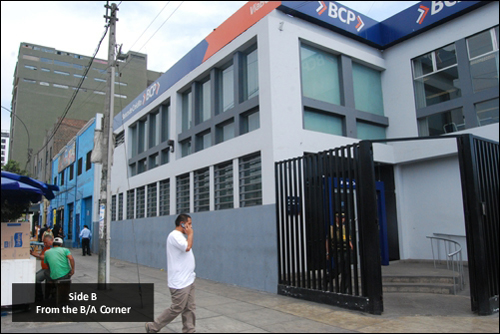
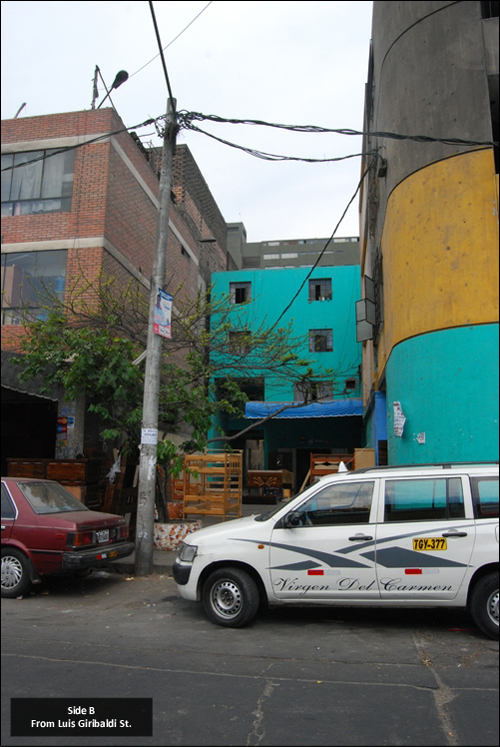
Figure 10. Side B

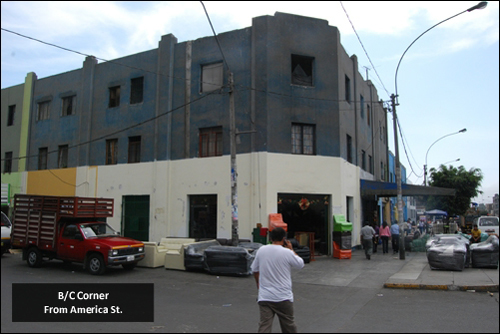
Figure 11. B/C Corner

As illustrated in Figures 10-11 this block is comprised of several attached, fire resistive buildings. It is difficult to determine the interior layout from the exterior as there are numerous openings in interior walls due to renovations and changes in occupancy over time. The floor plan illustrated in Figure 4 is the best estimate of conditions at the time of the fire based on interviews with members operating at the incident.

Figure 12. Side C and the Loading Dock Door

Figure 12shows Side C of the fire building and Exposure C and the loading dock door that was breached to provide access to the fire building from Side C immediately prior to the backdraft.

Figure 13. Side D and Exposure D

Figure 13illustrates the proximity of Exposure D, a three-story, fire-resistive apartment building.

Lessons Learned

This incident presented a number of challenges including a substantial fuel load (in terms of both mass and heat of combustion), fuel geometry (e.g., piled stock), and configuration (e.g., shielded fire, difficult access form Side C). Analysis of data from the short video clip and discussion of this incident with those involved provides a number of important lessons.

  • Knowledge of the buildings in your response area is critical to safe and effective firefighting operations. While a challenging task, particularly in a large city such as Lima, developing familiarity with common building types and configurations and pre-planning target hazards can provide a significant fireground advantage.
  • Reading the fire is essential to both initial size-up and ongoing assessment of conditions. In this incident, fire behavior indicators may have provided important cues needed to avoid the injuries that resulted from this extreme fire behavior event.
  • Some fire behavior indicators can be observed from one position, while others may not. It is particularly important that individuals in supervisory positions be able to integrate observations from multiple perspectives when anticipating potential changes in fire behavior.
  • Any opening, whether created for tactical ventilation or for entry has the potential to change the ventilation profile. It is important to consider potential changes in fire behavior that may result from changes in ventilation (particularly when the fire is ventilation controlled).
  • Communication and coordination are critical during all fireground operations. It is essential to communicate observations of key fire behavior indicators and changes in conditions to Command. Tactical ventilation (or other tactical operations that may influence fire behavior) must be coordinated with fire attack.
  • Protective clothing and self-contained breathing apparatus are a critical last line of defense when faced with extreme fire behavior (even when engaged in exterior, defensive operations).

I would like to recognize the members of the Peruvian fire service who assisted in my efforts to gather information about this incident and identify the important lessons learned. In particular, I would like to thank Teniente Brigadier Giancarlo Passalaqua, Brigadier CBP Oscar Ruiz, and my brothers at Lima 4 who generously shared their home, their time, and their knowledge.

Ed Hartin, MS, EFO, MIFIreE, CFO

When I was invited to Lima, I asked my friend Teniente Brigadier CBP Giancarlo Passalaqua who worked at this incident, if it would be possible to talk to other firefighters who were there and to walk the ground around the building to gain additional insight into this incident.

UL Ventilation Course

December 18th, 2010

Impact of Ventilation on Fire Behavior

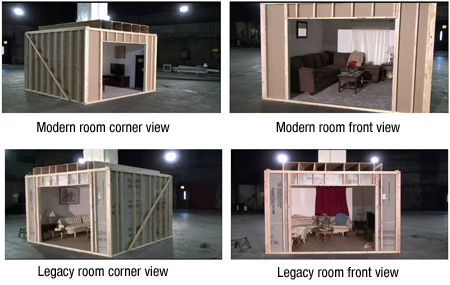
Earlier this year, Underwriters Laboratories (UL) conducted a series of full-scale experiments to determine the influence of ventilation on fire behavior in legacy and contemporary residential construction (see Did You Ever Wonder?).

UL University recently releases an on-line training program based on this research. Impact of Ventilation on Fire Behavior in Legacy and Contemporary Residential Construction is an excellent examination of the influence of ventilation on fire behavior and discussion of the tactical implications of the lessons learned through this research.

Every Firefighter and Fire Officer should complete
this training program within the next 30 days!

Completion of this on-line program could be the most important 90 minutes of training that you complete in the next year! I do not make this statement lightly. Understanding the relationship between ventilation and fire behavior is a critical competency for firefighters and fire officers.

After completing this on-line training program, consider the following questions and discuss them with the firefighters and fire officers you work with:

  • What are the indicators of a ventilation controlled fire?
  • How do your forcible entry and door entry procedures influence fire behavior?
  • How do you (or do you) coordinate fire attack and ventilation? How can tactical coordination be improved in your department?
  • What hazards are presented when performing VES (Vent, Enter, & Search) under ventilation controlled conditions? How can these hazards be mitigated?
  • What influence do closed doors have on the survivability profile (for either civilian occupants or trapped firefighters)?
  • What other lessons can you draw from this important research?

Research Report

In addition to the on-line course, UL has published a comprehensive report on this important research projects: Impact of Ventilation on Fire Behavior in Legacy and Contemporary Residential Construction.

Video

You can also download an excellent video illustrating the difference between fuel characteristics and loading in legacy and contemporary residential occupancies. This video is a tremendous tool to illustrate changes in the built environment to both firefighters and civilian audiences.

High Resolution Video

Low Resolution Video

Lima Backdraft

I am still working the report on my staff ride to the site of the 1997 backdraft at Luis Giribaldi Street and 28 de Julio Street in the Victoria section of Lima, Peru and should have it posted within the next week.

Ed Hartin, MS, EFO, MIFireE, CFO

Reading the Fire 15

November 29th, 2010

Greetings from Peru! I am writing this post in the kitchen of Station #100 in San Isidro, which is one of the districts in Lima. I am in Lima to speak on the concepts of practical fire dynamics and 3D Firefighting at a fire and rescue conference later in the week.

I would like to extend special thanks the Station Chief Paul Zarak and the members of Station 100 for making me welcome in their house. Paul and my friend Daniel Bacigalupo of Lima Station 4 picked me up at the airport and provided me with a great welcome to the Peru and the City of Lima.

Reading the Fire-The Journey Continues

Developing and maintaining proficiency in reading the Fire using the B-SAHF (Building, Smoke, Air Track, Heat, and Flame) organizing scheme for fire behavior indicators, requires practice. This post provides an opportunity to exercise your skills using a video segment shot during a fire in a detached garage. While a fairly simple incident, remember that the description of many tragic events begin with the words “it appeared to be a routine incident”. There are no routine incidents

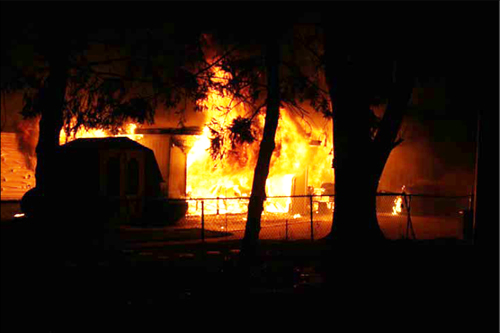
This post examines fire development during a fire in a detached garage with an exposed dwelling on Side C which occurred in Lake Station, Indiana. The video begins prior to the start of firefighting operations.

Download and the B-SAHF Worksheet.

Watch the first 25 seconds (0:25) of the video. First, describe what you observe in terms of the Building, Smoke, Air Track, Heat, and Flame Indicators; then answer the following five standard questions?

  1. What additional information would you like to have? How could you obtain it?
  2. What stage(s) of development is the fire likely to be in (incipient, growth, fully developed, or decay)?
  3. What burning regime is the fire in (fuel controlled or ventilation controlled)?
  4. What conditions would you expect to find inside this building?
  5. How would you expect the fire to develop over the next two to three minutes

watch the next 20 seconds (from 0:25 to 0:40). How do the B-SAHF indicators change? Why might this be the case?

Watch 20 seconds the video showing conditions at the doorway on Side B starting 50 seconds (0:50 to 1:10). Are the indicators visible from this vantage point similar to those on Side A? Why or why not?

Now watch the video up until the arrival of the first engine company (at 1:25). How do you think fire conditions are changing inside the garage? Is the heat release increasing, decreasing, or remaining relatively constant? Why?

Continue watching the video until 3 minutes 45 seconds (3:20). How do the smoke and air track indicators change (both before and after the overhead door on Side A was opened)?

At approximately 4:18 flames become visible from a window on Side C? Is this surprising? Why or why not?

How is a fire in a garage different than a fire in the living areas of a dwelling? How might these differences influence fire behavior and impact on firefighter safety?

Reading the Fire

See the following posts for more information on reading the fire:

Next Post

At breakfast this morning, I met Commander Oscar Ruiz member at Lima Station 4 and former Chief of Station 100. In 1997, Oscar was injured as the result of a backdraft while operating in the basket of an aerial platform at a commercial fire in the Victoria district of Lima. My next post will examine this incident and important lessons learned.

Ed Hartin, MS, EFO, MIFIreE, CFO

Homewood, IL LODD: Part 2

November 21st, 2010

This post continues examination of the incident that took the life of Firefighter Brian Carey and seriously injured Firefighter Kara Kopas on the evening of March 30, 2010  while they were operating a hoseline in support of primary search in a small, one-story, wood frame dwelling with an attached garage at 17622 Lincoln Avenue in Homewood, Illinois.

This post focuses on firefighting operations, key fire behavior indicators, and firefighter rescue operations implemented after rapid fire progression that trapped Firefighters Carey and Kopas.

Firefighting Operations

After making initial assignments, the Incident Commander performed reconnaissance along Side Bravo to assess fire conditions. Fire conditions at around the time the Incident Commander performed this reconnaissance are illustrated in Figure 7. After completing recon of Side B, the Incident Commander returned to a fixed command position in the cab of E-534 (in order to monitor multiple radio frequencies).

Figure 7. Conditions Viewed from Side C during the Incident Commander’s Recon

Note: John Ratko Photo from NIOSH Death in the Line of Duty Report F2010-10.

Engine 1340 (E-1340) arrived and reported to Command for assignment. The five member crew of this company was split to assist T-1220 with vertical ventilation, horizontally ventilate through windows on Sides B and D, and to protect Exposures D and D2.

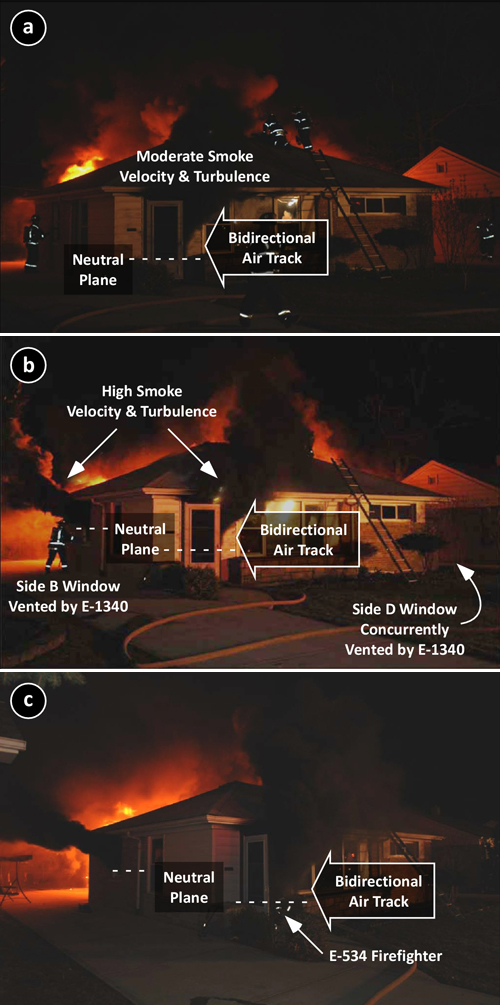
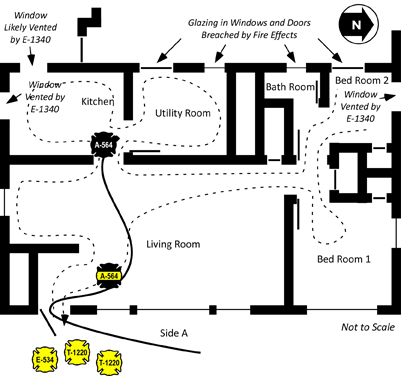
One member of E-1340 assisted T-1220 and the remaining members vented the kitchen windows on SidesD and B, while the E-1340 Officer stretched a 1-3/4” (45 mm) hoseline from E-534 to protect exposures on Side D. However, this line was not charged until signficantly later in the incident (see Figure 14). Figure 8 (a-c) illustrates changing conditions as horizontal ventilation is completed on Sides B and D.

Figure 8. Sequence of Changing Conditions Viewed from the A/B Corner

At 2105 Command reported that crews were conducting primary search and were beginning to vent.

Note the B-SAHF indicators visible from the A/B Corner in Figure 8a: Dark gray smoke from the door on Side A with the neutral plane at approximately 18” (0.25 m) above the floor. Velocity and turbulence are moderate and a bidirectional air track is evident at the doorway.

As the 2-1/2” (64 mm) handline reached the kitchen, flames were beginning to breach the openings in the Side C wall of the house and thick black smoke had banked down almost to floor level. As noted in Figure 3 (and subsequent floor plan illustrations), there were doors and windows between the house and addition in the Utility Room and Bedroom 2 . The Firefighter from E-534 had a problem with his protective hood and handed the nozzle off to Firefighter Carey and instructed him to open and close the bail of the nozzle quickly. After doing so, the Firefighter from E-534 retreated along the hoseline to the door on Side A to correct this problem (he is visible in the doorway in Figure 8c).

As E-1340 vents windows on Sides B (see Figure 8b) and D, the level of the neutral plane at the doorway on Side A lifts, but velocity and turbulence of smoke discharge increases. Work continues on establishing a vertical vent, but is hampered by smoke discharge from the door on Side A.

After horizontal ventilation of Sides B and D, velocity and turbulence of smoke discharge continues to increase and level of the upper layer drops to the floor as evidenced by the neutral plane at the door on Side A (see Figures 8b and 8c)

The photo in Figure 8c was taken just prior to the rapid fire progression that trapped Firefighters Carey & Kopas. The Firefighter from E-534 is visible in the doorway correcting a malfunction with his protective hood.

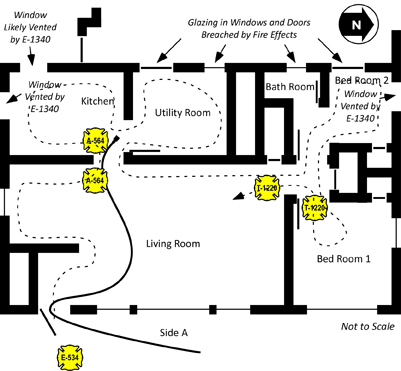
As T-1220B reached the hallway leading to the bedrroms, they felt a significant increase in temperature and visibility worsened. After searching Bedroom 2 and entering Bedroom 1 temperature contiued to increase and T-1220B observed flames rolling through the upper layer in the hallway leading from Bedroom 2 and the Bathroom. Note: NIOSH Death in the Line of Duty Report 2010-10 does not specify if T-1220B searched Bedroom 2, but this would be consistent with a left hand search pattern. They immedidately retreated to the Living Room looking for the hoseline leading to the door on Side A. As they did so, they yelled to the crew on the 2-1/2” (64 mm) handline to get out.

Extreme Fire Behavior

Firefighter Kopas felt a rapid increase in temperature as the upper layer ignited throughout the living room and the fire in this compartment transitioned to a fully developed stage. She yelled to Firefighter Carey, but received no response as she turned to follow the 2-1/2” (64 mm) hoseline back to the door on Side A. She made it to within approximately 4’ (1.2 m) of the front door when her protective clothing began to stick to melted carpet and she became stuck. T-1220B saw that she was trapped, reentered and pulled her out.

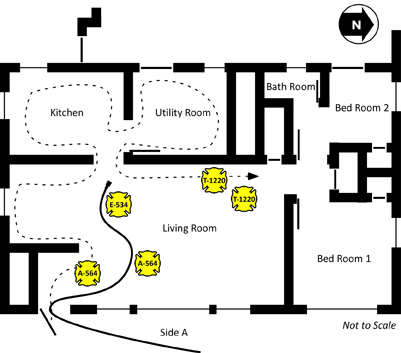
Figure 12. Position of the Crews as the Extreme Fire Behavior Phenomena Occurred

Note: It is unknown if T-1220B searched Bedroom 2 before entering Bedroom 1. However, this would be consistent with a left hand search pattern.

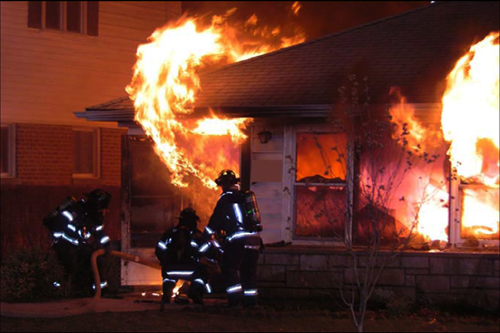
Figure 13. Conditions Viewed from the Alpha/Bravo Corner as the Extreme Fire Behavior Occured

Note: Warren Skalski Photo from NIOSH Death in the Line of Duty Report F2010-10.

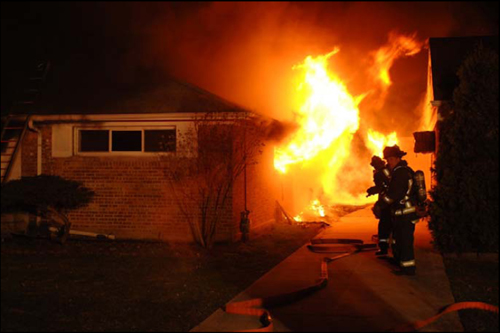
Figure 14. Conditions Viewed from the Alpha/Delta Corner as the Extreme Fire Behavior Occured

Note: Warren Skalski Photo from NIOSH Death in the Line of Duty Report F2010-10.

Following the transition to fully developed fire conditions in the living room, the Incident Commander ordered T-1220 off the roof. As illustrated in Figure 14, the exposure protection line stretched by E-1340 was not charged until after Firefighter Carey was removed from the building.

Figure 15. Position of Search and Fire Control Crews after Rapid Fire Progress

Firefighter Rescue Operations

The Incident Commander and Firefighter from E-534 (who had retreated to the door due to a problem with his protective hood), pulled a second 1-3/4” (45 mm) line from E-534. T-1220B re-entered the house with this hoseline to locate Firefighter Carey.

While advancing into the living room, T-1220B discovered that E-534’s 2-1/2” (64 mm) handline. They controlled the fire in the living room using a direct attack on burning contents and advanced to the kitchen where they discovered Firefighter Carey entangled in the 2-1/2” (64 mm) handline. Firefighter Carey’s helmet and breathing apparatus facepiece were not in place.

T-1220B removed Firefighter Carey from the building where he received medical care from T-1145. A short time later, Firefighter Carey became apenic and pulseless. After the arrival of Ambulance 2101 (A-2101), Firefighter Carey was transported to Advocate South Suburban Hospital in Hazel Crest, IL where he was declared dead at 10:03 pm.

According to the autopsy report, Firefighter Carey had a carboxyhemoglobin (COHb) of 30% died from carbon monoxide poisoning. The NIOSH Death in the Line of Duty Report (2010) did not indicate if the medical examiner tested for the presence of hydrogen cyanide (HCN) or if thermal injuries were a contributing factor to Firefighter Carey’s death.

Timeline

Review the Homewood, Illinois Timeline (PDF format) to gain perspective of sequence and the relationship between tactical operations and fire behavior.

Contributing Factors

Firefighter injuries often result from a number of causal and contributing factors. NIOSH Report F2010-10 identified the following contributing factors in this incident that led to the death of Firefighter Brian Carey and serious injuries to Firefighter Kara Kopas.

  • Well involved fire with trapped civilian upon arrival.
  • Incomplete 360o situational size-up
  • Inadequate risk-versus-gain analysis
  • Ineffective fire control tactics
  • Failure to recognize, understand, and react to deteriorating conditions
  • Uncoordinated ventilation and its effect on fire behavior
  • Removal of self-contained breathing apparatus (SCBA) facepiece
  • Inadequate command, control, and accountability
  • Insufficient staffing

Questions

The following questions focus on fire behavior, influence of tactical operations, and related factors involved in this incident.
  1. What type of extreme fire behavior phenomena occurred in this incident? Why do you think that this is the case (justify your answer)?
  2. How did the conditions necessary for this extreme fire behavior event develop (address both the fuel and ventilation sides of the equation)?
  3. What fire behavior indicators were present in the eight minutes between arrival of the first units and occurrence of the extreme fire behavior phenomena (organize your answer using Building, Smoke, Air Track, Heat, and Flame (B-SAHF) categories)? In particular, what changes in fire behavior indicators would have provided warning of impending rapid fire progression?
  4. Did any of these indicators point to the potential for extreme fire behavior? If so, how? If not, how could the firefighters and officers operating at this incident have anticipated this potential?
  5. What was the initiating event(s) that lead to the occurrence of the extreme fire behavior that killed Firefighter Carey and injured Firefighter Kopas?
  6. How did building design and construction impact on fire behavior and tactical operations during this incident?
  7. What action could have been taken to reduce the potential for extreme fire behavior and maintain tenable conditions during primary search operations?
  8. How would you change, expand, or refine the list of contributing factors identified by the NIOSH investigators?

Homewood, IL LODD

November 13th, 2010

Introduction

While formal learning is an essential part of firefighters’ and fire officers’ professional development, informal learning is equally important, with lessons frequently shared through the use of stores. Stories are about sharing knowledge, not simply about entertainment. It is their ability to share culture, values, vision and ideas that make them so critical. They can be one of the most powerful learning tools available (Ives, 2004). “Only by wrestling with the conditions of the problem at hand and finding his own way out, does [the student] think” (Dewey, 1910, p. 188).

Developing mastery of the craft of firefighting requires experience. However, it is unlikely that we will develop the base of knowledge required simply by responding to incidents. Case studies provide an effective means to build our knowledge base using incidents experienced by others. This case is particularly significant as the circumstances could be encountered by almost any firefighter.

Aim

Firefighters and fire officers recognize and respond appropriately to the hazards of ventilation controlled fires in small, Type V (wood frame), single family dwellings.

References

National Institute for Occupationsl Safey and Health (NIOSH). (2010). Death in the line of duty: Report F2010-10. Retrieved October 22, 2010 from http://www.cdc.gov/niosh/fire/pdfs/face201010.pdf.

Ives, B. (2004) Storytelling and Knowledge Management: Part 2 – The Power of Stories. Retrieved May 6, 2010 from http://billives.typepad.com/portals_and_km/2004/08/storytelling_an_1.html

Dewey, J. (1910) Democracy and education. New York: McMillan

Learning Activity

Review the incident information and discuss the questions provided. Focus your efforts on understanding the interrelated impact of ventilation and fire control tactics on fire behavior. Even more important than understanding what happened in this incident is the ability to apply this knowledge in your own tactical decision-making.

The Case

This case study was developed using NIOSH Death in the Line of Duty: Report F2010-10 (NIOSH, 2010).

On the evening of March 30, 2010, while operating at a fire in a small single family dwelling, Firefighter/Paramedic Brian Carey and Firefighter/Paramedic Kara Kopas were assigned to assist in advancement of a 2-1/2” handline for offensive fire attack and to support primary search. Shortly after entering the building conditions deteriorated and they were trapped by rapid fire progression. Firefighter Kopas suffered 2nd and 3rd degree burns to her lower back, buttocks, and right wrist. Firefighter Carey died from carbon monoxide poisoning and inhalation of smoke and soot. A 84 year old male civilian occupant also perished in the fire.

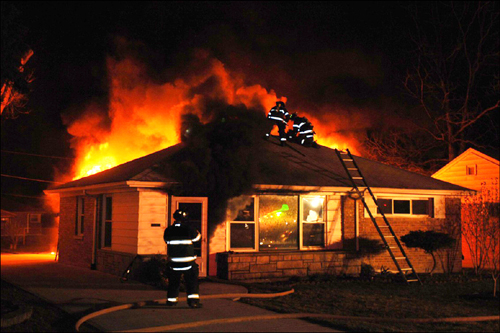
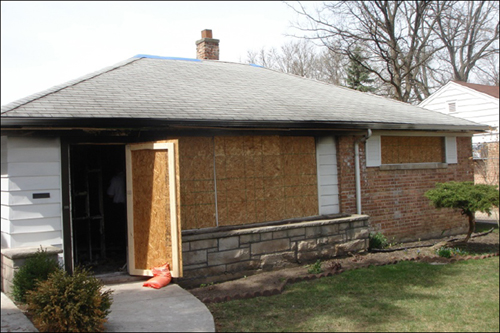
Figure 1. Side A Post Fire

Side A Post Fire

Note: National Institute for Occupational Safety and Health (NIOSH)

Building Information

This incident involved a 950 ft2 (88.26 m2), one-story, single family dwelling constructed in 1951. The house was of Type V (wood frame) construction with a hip roof covered with asphalt shingles. The roofline of the hip roof provided a small attic space. Sometime after the home was originally constructed an addition C was built that attached the house to a garage located on Side C. Compartment linings were drywall. The house, garage, and addition were all constructed on a concrete slab.

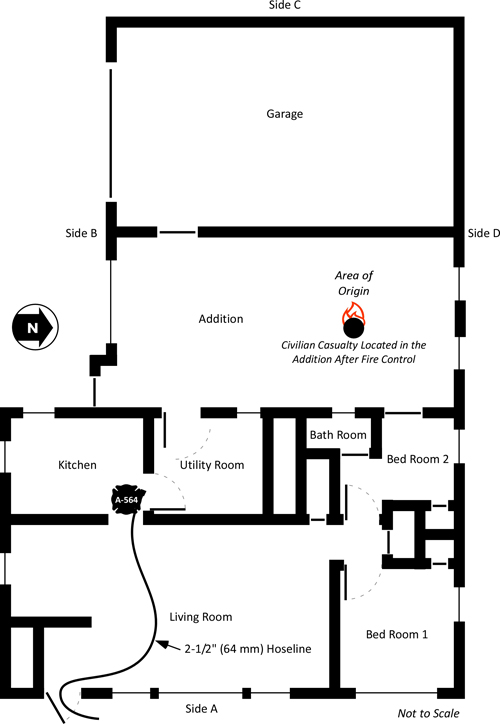
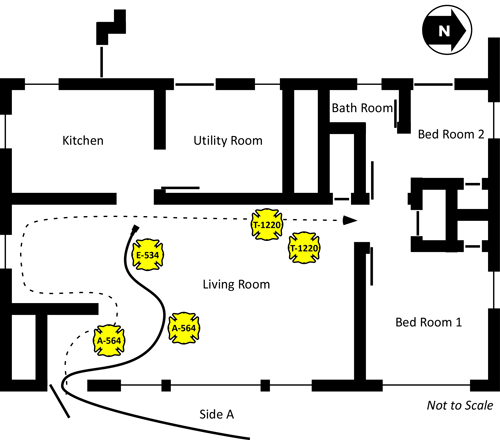
There were several openings between the house and addition, including two doors, and two windows (see Figure 3).

Note: The number and nature of openings between the garage and addition is not reported, but likely included a door and possibly a window (given typical garage construction). NIOSH investigators did not determine if the doors and windows between the house, addition, and garage were open or closed at the time of the fire as they were consumed by the fire and NIOSH did not interview the surviving occupant (S. Wertman, personal communication, November 17, 2010). The existence and position of the door shown in the wall between the addition and garage is speculative (based on typical design features of this type of structure).

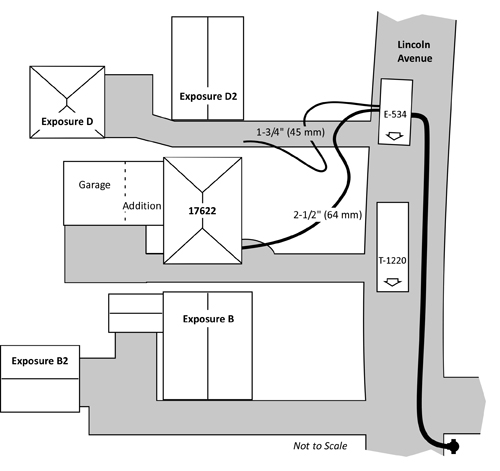
Figure 2. Plot Plan and Apparatus Positioning

Figure 3. Floor Plan 17622 Lincoln Avenue

The Fire

Investigators believe that the fire originated in an addition that was constructed between the original home and the two-car garage. The surviving occupant reported that she observed black smoke and flames from underneath the chair that her disabled husband was sitting in.

The addition was furnished as a family room and fuel packages included upholstered furniture and polyurethane padding. The civilian victim also had three medical oxygen bottles (one D Cylinder (425 L) and two M-Cylinders (34 L). It is not know if the oxygen in these cylinders was a factor in fire development. The garage contained a single motor vehicle in the garage and other combustible materials.
After calling 911 and attempting to extinguish the fire, the female occupant exited the building. NIOSH Death in the Line of Duty Report 2010-10 did not specify this occupants egress path or if she left the door through which she exited open or closed (NIOSH did not interview the occupant, she was interviewed by local fire and law enforcement authorities). The NIOSH investigator (personal communications S. Wertman, November 17, 2010) indicated that the occupant likely exited through the exterior door in the addition or through the door on Side A. Give rapid development through flashover in the addition, it is likely that the exterior door in the addition or door to the garage was open, pointing to the likelihood that the occupant exited through this door. Subsequent rapid extension to the garage was likely based on design features of the addition and garage or some type of opening between these two compartments. As similar extension did not occur in the house, it is likely that the door and windows in the Side C wall of the house were closed.

In the four minutes between when the incident was reported (20:55 hours) and arrival of a law enforcement unit (20:59), the fire in the addition had progressed from the incipient stage to fully developed fire conditions in both the addition and garage.

Dispatch Information

At 2055 hours on March 30, 2010, dispatch received a call from a resident at 17622 Lincoln Avenue stating that her paralyzed husband’s chair was on fire and that he was on oxygen. The first alarm assignment consisting of two engines, two trucks, a squad, and ambulance, and fire chief was dispatched at 2057.

Table 1. On-Duty and Additional Unit Staffing of First Alarm Resources

Unit

Staffing

Engine 534 Lieutenant, Firefighter, Engineer
Ambulance 564 2 Firefighter Paramedics
Truck 1220 (Auto Aid Department) Lieutenant, 2 Firefighters, Engineer
Engine 1340 (Auto Aid Department) Lieutenant 3 Firefighters, Engineer
Truck 1145 (Auto Aid Department) Lieutenant, 2 Firefighters, Engineer
Squad 440 (Auto Aid Department) Lieutenant, 3 Firefighters
Chief Chief

Note: This table was developed by integrating data from Death in the Line of Duty Report 2010-10 (NIOSH, 2010).

Weather Conditions

The weather was clear with a temperature of 12o C (53o F). Firefighters operating at the incident stated that wind was not a factor.

Conditions on Arrival

A law enforcement officer arrived prior to fire companies and reported that the house was “fully engulfed” and that the subject in the chair was still in the house.

Truck 1220 (T-1220) arrived at 2101, observed that the fire involved a single family dwelling, and received verbal reports from law enforcement and bystanders that the male occupant was still inside. Note: The disabled male occupant’s last known location was in the addition between the house and garage, but it is unknown if this information was clearly communicated to T-1220 or to Command (E-534 Lieutenant).

Engine 534 (E-534) arrived just behind T-1220 and reported heavy fire showing. E-534 had observed flames from Side C during their response and discussed use of a 2-1/2” (64 mm) handline for initial attack.

Firefighting Operations

Based on the report of a trapped occupant, T-1220B (Firefighter and Apparatus Operator) prepared to gain entry and conduct primary search. Note: Based on data in NIOSH Death in the Line of Duty Report 2010-10, it is not clear that this task was assigned by the initial Incident Commander (Engine 534 Lieutenant). It appears that this assignment may have been made by the T-1220 Lieutenant, or performed simply as a default truck company assignment for offensive operations at a residential fire.

Upon arrival, the E-534 Lieutenant assumed Command and transmitted a size-up report indicating heavy fire showing. The Incident Commander(E-534 Lieutenant) assisted the E-534 Firefighter with removal of the 1-3/4” (45 mm) skid load from the solid stream nozzle on the 2-1/2” (64 mm) hose load and stretching the 2-1/2” (64 mm) handline to the door on Side A. The E-534 Apparatus Operator charged the line with water from the apparatus tank and then hand stretched a 5” supply line to the hydrant at the corner of Lincoln Avenue and Hawthorne Road with the assistance of a Firefighter from T-1220.

Figure 4. Initiation of Primary Search

The Incident Commander (E-534 Lieutenant) assisted T-1220B in forcing the door on Side A. T-1220B made entry without a hoseline and began a left hand search as illustrated in Figure 4, noting that the upper layer was banked down to within approximately 3’ (0.9 m) from the floor).

Arriving immediately after E-534, the crew of A-564 donned their personal protective equipment and reported to the Incident Commander at the door on Side A, where he and the E-534 Firefighter were preparing to make entry with the 2-1/2” hoseline. The Incident Commander then assigned A-564 to work with the E-534 Firefighter to support search operations and control the fire.

T-1220 initiated roof operations and began to cut a ventilation opening on Side A near the center of the roof. Note: Based on data in NIOSH Death in the Line of Duty Report 2010-10, it is not clear that this task was assigned by the initial Incident Commander (Engine 534 Lieutenant). It appears that this assignment may have been made by the T-1220 Lieutenant, or performed simply as a default truck company assignment for offensive operations at a residential fire.

As illustrated in Figure 5, a large body of fire can be observed on Side C and a bi-directional air track is evident at the point of entry on Side A with dark gray smoke pushing from the upper level of the doorway at moderate velocity. All windows on Sides A and B were intact, with evidence of soot and/or condensed pyrolizate on the large picture window adjacent to the door on Side A.

Figure 5. Conditions Viewed from the Alpha/Bravo Corner at Approximately

Note: Warren Skalski Photo from NIOSH Death in the Line of Duty Report F2010-10.

The Firefighter from E-534 took the nozzle and assisted by Firefighters Carey and Kopas (A-564) stretched the 2-1/2” (64 mm) handline through the door on Side A and advanced approximately 12’ (3.66 m) into the kitchen. As they advanced the hoseline, they were passed by T-1220B, conducting primary search. The E-534 Firefighter, Firefighter Kopas (A-564), and T-1220B observed thick (optically dense), black smoke had dropped closer to the floor and that the temperature at floor level was increasing.

Figure 6. Primary Search and Fire Control Crews

Questions

Take a few minutes and consider the answers to the following questions. Remember that it is much easier to sort through the information presented by the incident when you are reading a blog post, than when confronted with a developing fire with persons reported!

  1. What B-SAHF (Building, Smoke, Air Track, Heat, & Flame) indicators were observed during the initial stages of this incident?
  2. What stage(s) of fire and burning regime(s) were present in the building when T-1220 and E-534 arrived? Consider potential differences in conditions in the addition, garage, kitchen, bedrooms, and living room?
  3. What would you anticipate as the likely progression of fire development over the next several minutes? Why?
  4. How might tactical operations (positively or negatively) influence fire development?

Ed Hartin, MS, EFO, MIFireE, CFO

Note: The number and nature of openings between the garage and addition is not reported, but likely included a door and possibly a window (given typical garage construction). NIOSH investigators did not determine if the doors and windows between the house, addition, and garage were open or closed at the time of the fire as they were consumed by the fire and NIOSH did not interview the surviving occupant (S. Wertman, personal communication, November 17, 2010). The existence and position of the door shown in the wall between the addition and garage is speculative (based on typical design features of this type of structure).

Flow Rate and Nozzle Design

October 21st, 2010

A number of years ago, several nozzle manufacturers developed a break apart combination nozzle (shutoff separate from the tip) with an integrated solid stream tip. This design allowed the user to adjust the pattern using the combination tip, or if desired, remove the combination tip and use the nozzle to develop a solid stream. Good idea or not? On the surface this sounds like it might be a reasonable idea. The combination tip allows adjustment of the pattern while the internal solid stream may provide improved performance in penetration to reach burning fuel surfaces. In addition, if the combination tip became clogged with debris it is also possible to remove the tip and still have the capability to develop a usable fire stream.

Used on various size handlines, internal solid stream tips are generally available in sizes ranging from 7/8” to 1-1/4”. What effect does an integrated solid stream tip have on nozzle performance when a combination tip is used? Manufacturers such as Elkhart Brass and Task Force Tips warn that the integrated smooth bore tip may restrict the flow of single flow, variable flow, or automatic combination tips.

CWIFR Nozzle Tests

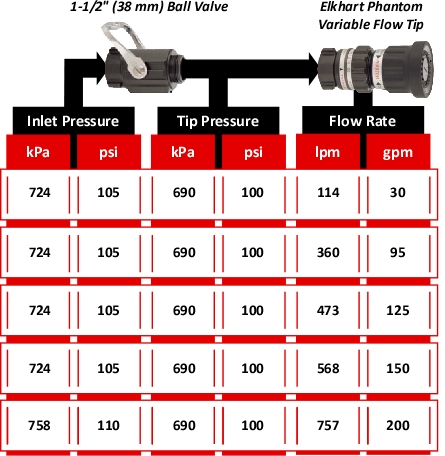
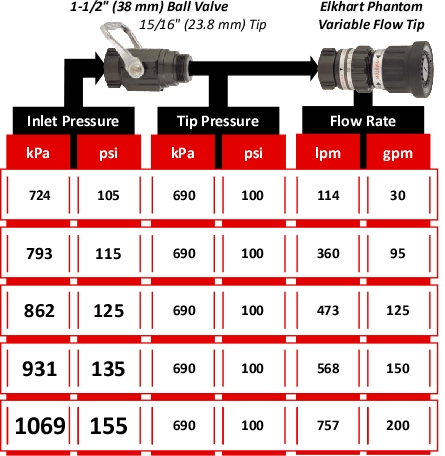
Tests conducted by Firefighter Jim Huff of Central Whidbey Island Fire & Rescue (CWIFR) demonstrate the potential friction loss impact of integrated solid stream tips. CWIFR conducted flow tests using an mid-range Elkhart Phantom tip, a 1-1/2” (38 mm) ball valve, and a 1-1/2” (38 mm) ball valve with an integrated 15/16” (23.8 mm) tip. Line gages were inserted at the base of the nozzle and between the shutoff and the tip. Nozzle inlet pressure was adjusted to maintain the designed nozzle pressure of 100 psi (690 kPa) at the tip and pressure measurements were made at each of the nozzles flow settings of 30, 95, 125, 150, and 200 gpm (114, 360, 473, 658, and 757 lpm).

As illustrated in Figure 1, the ball valve without the integrated tip had limited impact on tip pressure.

Figure 1. Full Flow Ball Valve

However, the results obtained when using a 1-1/2” (38 mm) ball valve with an integrated 15/16” (23.8 mm)solid stream tip were dramatically different. As illustrated in Figure 2, a considerably higher inlet pressure was required to provide the designed operating pressure of 100 psi (690 kPa) at the tip.

Figure 2. Ball Valve with a Solid Stream Tip

When equipped with an integrated solid stream tip, the friction loss in the nozzle shutoff is significantly impacted by tip size (the smaller the tip, the greater the friction loss at a given flow rate).

This is My Nozzle

As stated in My Nozzle:

This is my nozzle, there are many like it but this one is mine. My nozzle is my best friend. It is my life. I must master it as I master my life. Without me it is useless, without my nozzle I am useless.

I will use my nozzle effectively and efficiently to put water where it is needed. I will learn its weaknesses, its strengths, its parts, and its care. I will guard it against damage, keep it clean and ready. This I swear.

It is essential that firefighters, apparatus operators, and fire officers have an in-depth knowledge of their tools. A handline nozzle is your primary firefighting weapon in offensive firefighting operations, develop your nozzle knowledge and master this important tool.

Ed Hartin, MS, EFO, MIFireE, CFO

Gas Cooling: Part 5

October 6th, 2010

This is the last post in the series examining the science of gas cooling as a fire control tactic. Be forewarned, there is math ahead! I have made an attempt at providing sufficient explanation to allow firefighters, fire officers, and instructors to develop an understanding the scientific concepts underlying this fire control technique. My next post will return to the topic of extreme fire behavior and ventilation with discussion of the most recently released NIOSH report, Death in the Line of Duty 2010-10.

The Mathematical Explanation

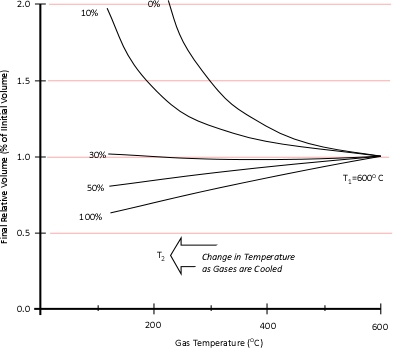
Dr. Stefan Särdqvist provides a mathematical explanation of volume changes during smoke/gas cooling In Water and Other Extinguishing Agents (Särdqvist,2002). Stefan’s text includes a graph that illustrates volume changes based on the extent to which the upper layer is cooled and the percentage of the water that is vaporized in the hot gases versus on contact with hot surfaces. As illustrated in Figure 1, the relative volume (expansion or contraction) of the upper layer during gas cooling is dependent on the percentage of water vaporizing as water passes through the hot gases of the upper layer and the percentage of water vaporizing on contact with hot surfaces such as compartment linings.

Figure 1. Volume Changes During Gas Cooling

Note: Adapted from Water and Other Extinguishing Agents (p. 155), by Stefan Särdqvist, 2002, Karlstad, Sweden: Räddnings Verket. Copyright 2002 by Räddnings Verket

If 100% of water applied for cooling vaporizes in the upper layer, the total volume of the hot fire gases and steam in the upper layer will be 79% of the original volume of the hot gases alone. If approximately 30% of the cooling water vaporizes in the upper layer and 70% vaporizes on contact with hot surfaces such as compartment linings (e.g., ceiling, walls) the volume of the upper layer will remain the same. However, if less than 30% of the cooling water is vaporized in the upper layer and the remainder is vaporized on contact with hot surfaces, the volume of the upper layer (hot fire gases and steam) will increase.

Understanding why this is the case requires a good understanding of the ideal gas law and a willingness to work through the math. As Greg Gorbett and Jim Pharr observe in the math review chapter of Fire Dynamics (2010), “The term algebra inspires dread in many otherwise competent, confident people” (p. 16).

Gas Cooling and the Ideal Gas Law

Gas Cooling: Part 4, examined the expansion ratio of steam using the Ideal Gas Law, providing a worked example to illustrate how to solve for the change in volume when water is vaporized to steam. As illustrated below, the Ideal Gas Law can also be used to determine relative influences of contraction of the upper layer and expansion of steam during gas cooling.

Before the application of water:

After the application of water:

Where:

P=Pressure (Pa)

V= Volume (m3)

T=Temperature (K)

n=Moles

Ru=Universal Gas Constant (8.3145 J/mol K)

Subscript of 1 refers to initial conditions where the upper layer consists of hot smoke and air

Subscript of 2 refers to conditions at (later) time where the upper layer consists not only to the hot smoke and air, but also to the water applied for cooling (the number of molecules in the upper layer increases, and temperature changes).

Another way of expressing the initial and final conditions using the two gas laws is to set them equal to one another:

Pressure (P) in the fire compartment and adjacent compartments remains relatively constant (due to compartment openings and other leakage). For example, the National Fire Protection Association (NFPA) Standard 92A Standard for Smoke Control Systems Using Barriers and Pressure Differences (2009) specifies a design pressure difference of 24.9 Pa (0.0036 psi) to exclude smoke from a protected area (such as a stairwell) in a non-sprinklered building with 2.7 m (9’) ceilings. As atmospheric pressure is 102325 Pa (14.7 psi) the pressure difference, while significant enough to influence smoke movement is actually quite small in most cases. Given that pressure is relatively constant and the Universal Gas Constant (Ru) is the same for all ideal gases, these factors will have the same effect on initial and final conditions (allowing both Ru and P to be factored out of the ideal gas equations used to determine changes in upper layer volume.

After factoring out Ru and P, the relationship between the upper layer volume before and after application of water is as follows:

Lots Going On!

When water is applied to cool the upper layer, there is quite a bit going on. Energy is transferred from the upper layer to the water, lowering the temperature of the upper layer and raising the temperature of the water to its boiling point, vaporizing the water, and raising the temperature of the resulting steam. As the absolute temperature of the upper layer is reduced, its volume is proportionally reduced. However, as water is vaporized at its boiling point and the absolute temperature of the resulting steam is increased its volume increases. The important question is where was the water vaporized? Water vaporized in the upper layer, absorbed energy from the hot gases, lowering their absolute temperature. However, water that passes through the hot gas layer and vaporizes on contact with hot surfaces such as compartment linings (e.g., ceiling, walls) did not absorb significant energy from the upper layer and did not significantly reduce the temperature of the upper layer. Steam produced as a result of water vaporizing on contact with hot surfaces can absorb energy from the upper layer, but this has far less impact than water vaporized within the upper layer due to the large difference between the specific heat of steam and the latent heat of vaporization of water.

While some energy is lost as a result of convection of hot gases out compartment openings and conduction through compartment linings and other structural materials, these factors are not considered in this analysis of the effect of gas cooling. In this analysis the compartment defines the bounds of the thermodynamic system and the gas cooling process is considered to be adiabatic (no energy is gained or lost by the system).

Step by Step

I have made a few revisions to the explanation of gas cooling in Water and Other Extinguishing Agents (Särdqvist,2002), most significant of which is inclusion of the energy required to raise the temperature of the water applied for cooling to its boiling point (100o C). While the amount of energy is not large, this addition provides a more complete picture of the process involved in gas cooling. Other changes include consistent use of J/mol as units for specific heat and latent heat of vaporization, and minor variations in notation.

The mathematical explanation of gas cooling starts out in the same place as the concrete example provided in Gas Cooling Parts 1 and 2, determining the energy that must be transferred from the upper layer to water applied for cooling in order to achieve a specific reduction in temperature and the amount of water required to accomplish this. However, unlike an example using a specific compartment in which the units for specific heat and latent heat of vaporization were J/kg, the mathematical explanation uses J/mol (the reason for this will become clear as we dig a bit deeper).

The relationship between J/mol and kJ/kg as units of measure for specific heat and latent heat of vaporization is fairly straightforward as illustrated below:

The following equation explains the energy balance between hot gases in the upper layer and water applied for cooling. At first glance, this equation seems extremely complex, but if each segment is examined individually, it is fairly straightforward.

Where

Cp,g=Specific heat capacity of fire gases/smoke (approximately the same as air, 33.2 J/mol K at 1000 K).

Cp,st=Specific heat capacity of steam (41.2 J/mol K at 1000 K)

Cp,w=Specific heat capacity of water (76.663 J/mol K at 215.15 K)

LV,w=Latent heat of vaporization of water 40,680 J/mol

Tu=Temperature of the upper layer (K)

Tw=Temperature of water (K)

n=Moles

Subscript of 1 refers to initial conditions

Subscript of 2 refers to conditions at (later) time 2

First examine the left side of the equation which deals with the hot gases in the upper layer.

The left side of the equation determines the energy that must be transferred from the hot gases in the upper layer in order to result in a specific reduction in temperature. As this example does not deal with a specific compartment, the mass of the upper layer is unknown. A challenge resolved through the use of moles to define the amount of hot fire gases present in the upper layer. Remember that moles are a measure of the number of molecules present.

Multiplying the molar specific heat of smoke (Cp,g) in J/mol K by the number of moles (n) determines the energy that must be transferred from the upper layer to change its temperature 1 K. Multiplying that value by the change in absolute temperature (T1-T2) determines the total energy that must be transferred to achieve the specified change in absolute temperature.

Now examine the right side of the equation which deals with the water applied for cooling:

The right side of the equation determines the energy that must be transferred to the water applied for cooling in order to increase the temperature of the water (as steam) by the same extent as the reduction in upper layer temperature.

The first step is to determine the amount of water applied (remember the assumption that all water applied is vaporized either in the gas layer or on contact with surfaces). This is accomplished by subtracting the amount of hot gases in the upper layer (in Moles) from the amount of hot gases, and steam in the upper layer after cooling the gases (n2 – n1).

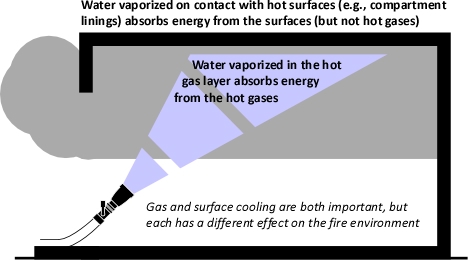
When vaporized in the upper layer, energy is transferred from the hot gases in the upper layer to 1) raise the temperature of the water to its boiling point of 373.15 K (100o C), 2) to change its state from liquid phase to gas phase, and 3) to raise the temperature of the steam until reaching equilibrium (hot gases and steam are at the same temperature). When water is vaporized on contact with a hot surface, it did not absorb significant energy while traveling through the hot gasses of the upper layer. The energy necessary to raise the temperature of the water to its boiling point and vaporize it is absorbed from the surface. Steam produced in this manner will also absorb energy from the hot gases of the upper layer (but the process of increasing the temperature of the water in liquid form and vaporization did not take significant energy from the hot gasses of the upper layer).

Figure 2. Gas Versus Surface Cooling

As water that is vaporized in the upper layer absorbs energy from the hot gases to raise its temperature to boiling and vaporize.

The temperature increase required for water to reach its boiling point is determined by subtracting the initial temperature of the water (Tw,1) from its boiling point of 373.15 K. The increase in the temperature of the water in liquid form is multiplied by the specific heat of water (Cp,w) to calculate the total energy required for this temperature increase (Cp,w (373.15- Tw,1)).

The latent heat of vaporization (LV,w) is added to the energy required to raise the temperature of the water from Tw1 to its boiling point of 373.15 K (100o C).

After water is vaporized (either while traveling through the upper layer or on contact with a hot surface) it continues to absorb energy from the upper layer until the temperature of the steam and the hot gases in the upper layer reach the same temperature and are in thermal equilibrium. The specific heat of steam (Cp,w) is multiplied by the difference between 373.15 K (100o C) and the final temperature of the upper layer (Tu2). This determines the energy required for the steam and the hot gases in the upper layer to reach thermal equilibrium ( ).

As with the calculations examining the smoke and hot gases in the upper layer, moles are a measure of the amount of water applied for cooling. As the thermodynamic system of the compartment is being treated as adiabatic (no energy leaves the system, it is simply transferred between the hot gases of the upper layer and the water applied for cooling), the left and right sides of the equation must be equal.

Solving for n, this equation may also be written:

Given that:

The left side of the equation can be simplified to solve for the amount of molecules in the upper layer before cooling (n1) and after application of water (n2) as follows:

Solving for n allows the energy exchange equation to be combined with the two ideal gas laws used to describe changes in volume associated with gas cooling.

As the energy exchange equation is equal to the initial amount of gas molecules in the upper layer before gas cooling divided by the amount of gas molecules in the upper layer after the application of water, the energy balance equation can be inserted in the ideal gas law in place of the amount of molecules (n1 and n2) as illustrated below:

This formula looks quite complex, but in actuality most of the values are constants such as the specific heat of water (Cp,w), latent heat of vaporization of water (LVw), and specific heat of steam (Cp,st). After plugging in these constants, the only variables on the right side of the equation are the temperature of the upper layer before and after cooling and the percentage of water vaporized in the upper layer.

The volume of the upper layer after cooling divided by the volume of the upper layer before cooling is the percentage change in volume of the upper layer.

Worked Examples

While explaining the equations is important, there is nothing quite so useful in developing understanding as actual worked examples. In each of these examples, the initial upper layer temperature is 773.15 K (500o C), the initial temperature of the cooling water is 293.15 K (20o C) and the final temperature of the upper layer is 473.15 K (200o C).

Example 1: All (100%) of the water applied for cooling is vaporized in the upper layer.

In this example where all of the water applied for cooling is vaporized in the upper layer, the volume of the upper layer is reduced by 27% and the lower boundary of the upper layer would rise. This illustrates the ideal (but likely not achievable) application of gas cooling to reduce temperature and raise the lower boundary of the upper layer.

Example 2: None (0%) the water applied for cooling is vaporized in the upper layer; all of it is vaporized on contact with hot compartment linings or other surfaces.

In this example where none of the water applied for cooling is vaporized in the upper layer, but vaporizes on contact with hot surfaces, the volume of the upper layer would double. If the upper layer filled more than half the volume of the compartment, the upper layer would then fill the entire compartment with hot gases and steam at 473.15 K (200o C), providing an untenable environment for both firefighters and trapped occupants. This is why an indirect attack is not used from inside the compartment or in compartments where there may be savable victims.

Example 3: One third (33.3%) of the water applied for cooling vaporizes in the upper layer and the remainder (66.6%) is vaporized on contact with hot compartment linings or other surfaces.

In this example, the volume of the upper layer is unchanged, but considerably cooler than before the application of water. If firefighters had adequate working area below the upper layer before applying cooling water, this would be unchanged, but the temperature of the gases overhead would be considerably reduced. With good technique and an appropriate flow rate, more than 33.3% of the water applied for cooling can be vaporized in the upper layer, providing practical results somewhere between a 3% (Example 3) and 27% (Example 1) reduction in the volume of the upper layer. However, it is important to remember that the fireground is much more dynamic than the simple analysis presented in this post.

Different Parts of the Elephant

Firefighter’s perspectives on the use of water fog for interior structural firefighting can be compared to the Indian fable of The Six Blind Men and the Elephant (Saxe, 1963). In this fable, the six men tried to determine what an elephant was. As none of the men could see, they used their sense of touch. However, each grasped a different part of the elephant. One touched the side and thought an elephant was like a wall, another the trunk and thought an elephant was like a snake, and so forth. What you believe may be limited by your point of observation.

Many firefighters in the United States find it hard to believe that the volume of the upper layer can be reduced and the bottom of the upper layer raised by application of water. This is inconsistent with their experiences in the field. The explanation provided in this post illustrates how this is possible. If flow rate and application technique used result in more than 70% of cooling water vaporizing on contact with hot surfaces, the upper layer will increase in volume and the level of the hot gas layer in a confined area such as a compartment will become lower (consistent with many firefighters experience when using water fog for interior structural firefighting). However, this does not have to be the case. Where the water is vaporized and the resulting effects are dependent on application technique, flow rate, and duration of application!

I would like to extend a great deal of thanks to Stefan Särdqvist for providing the basis for this explanation and to Lieutenant Felipe Baeza Lehnert of Valdivia (Chile) Fire Department Company 1 (Germania) for his patience in helping me sort though the math.

Ed Hartin, MS, EFO, MIFireE, CFO

References

National Fire Protection Association (NFPA). (2009). Standard 92A Standard for Smoke Control Systems Using Barriers and Pressure Differences. Quincy, MA: Author.

Saxe, J. (1963). The blind men and the elephant. New York: McGraw-Hill

Särdqvist, S. (2002) Water and other extinguishing agents. Karlstad, Sweden: Räddnings Verket

Gas Cooling: Part 4

September 12th, 2010

Reading the Fire

Before returning to discussion of the science underlying gas cooling as a fire control technique, I wanted to share a video of an industrial fire in Maidencreek Township, Pennsylvania that provides an excellent illustration of smoke and air track indicators. Watch the first minute (1:00) of the video and answer the following questions:

  • Consider how you would read the smoke and air track indicators (particularly the level of the neutral plane and velocity) if this was a single family dwelling. How is air track indicators are different in a large building (with multiple ventilation openings) such as was the case in this incident?
  • What stage of development (incipient, growth, fully developed, or decay) and burning regime (fuel or ventilation controlled) is this fire in?
  • Watch the remainder of the video and examine the effectiveness of the master stream application? Are the streams effective? Why or why not? What could be done to increase the effectiveness of application?

For additional information on reading the fire, see the following posts:

Gas Laws

Paraphrasing Albert Einstein, British science writer Simon Singh stated that, “Science has nothing to do with common sense. Common sense is a set of prejudices” (Capps, 2010, p. 115). One of the challenges faced by firefighters engaging with the science of their craft is the common sense understanding of the fire environment and firefighting practices. This post continues examination of gas cooling as a fire control technique, by peeling off a few more layers and digging deeper into the underlying science related to the behavior of gases.

Readers who have worked through Gas Cooling Part 1, Part 2, and Part 3 have a reasonable idea how a small volume of water can reduce the temperature of the upper layer in a compartment and also reduce the volume of the upper layer (raising the level of the lower boundary of the layer). In addition, readers are likely to also understand the limitations of the simple explanation provided in prior posts.

In Water and Other Extinguishing Agents (Särdqvist,2002), Dr. Stefan Särdqvist provides a fairly detailed explanation of volume changes during smoke cooling and examines how the percentage of water vaporizing in the upper layer influences these changes. Understanding Stefan’s explanation requires a good understanding of the ideal gas law and a willingness to work through the math.

Gas Laws

The introduction to the gas laws and overview of Charles’s Law was provided in Gas Cooling: Part 3. This content has been repeated in this post, to save you from going back to the previous post.

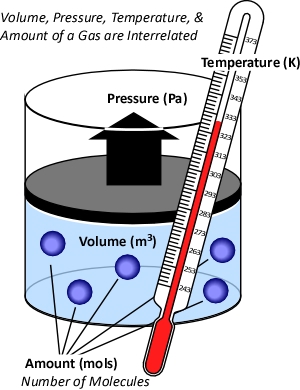
While gases have different characteristics and properties, the behavior of gases can be described in general terms using the ideal gas law. This physical law describes the relationship between absolute temperature, volume, and pressure of a given amount of an ideal gas.

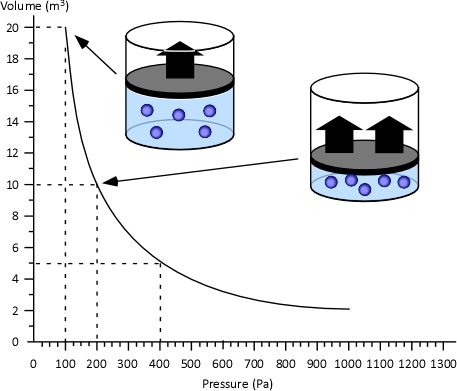
Figure 1. Temperature, Volume, Pressure & Amount

The concept of an ideal gas is based on the following assumptions:

  • Gases consist of molecules in random motion
  • The volume of the molecules is negligible in comparison to the total volume occupied by the gas
  • Intermolecular forces (i.e., attractive forces between molecules) are negligible
  • Pressure is the result of gas molecules colliding with the walls of its container

The ideal gas law is actually a synthesis of several other physical laws that each describes a single characteristic of the behavior of gases in a closed system (enclosed in some type of container).

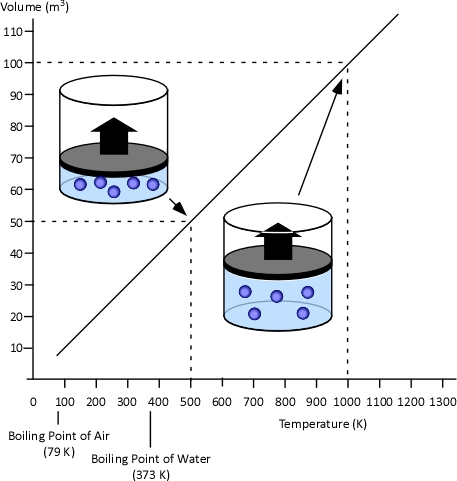
Charles’s Law: In the 1780s, French scientist Jacques Charles studied the effect of temperature on a sample of gas at a constant pressure. Charles found that as the gas was heated, the volume increased. As the gas was cooled, the volume decreased. This finding gave rise to Charles’s Law which states that at a constant pressure the volume of a given amount (mass or number of molecules) of an ideal gas increases or decreases in direct proportion with its absolute (thermodynamic) temperature. The symbol  is used to express a proportional relationship (much the same as = is used to express equality), so this relationship can be expressed as:

Where:

V=Volume

T=Temperature

When two values (such as volume and temperature in Charles’s Law) are proportional, one is a consistent multiple of the other. For example If one value was consistently eight times the other, the values would also be proportional. In the case of Charles’s Law when the absolute temperature of a gas doubles, the pressure doubles. Figure 2 illustrates the relationship between absolute temperature in Kelvins (K) and volume in cubic millimeters (mm3).

Figure 2. Charles’s Law

This relationship can also be stated using the following equation:

Where

V=Volume

T=Temperature

Subscript of 1 refers to initial conditions

Subscript of 2 refers to final conditions

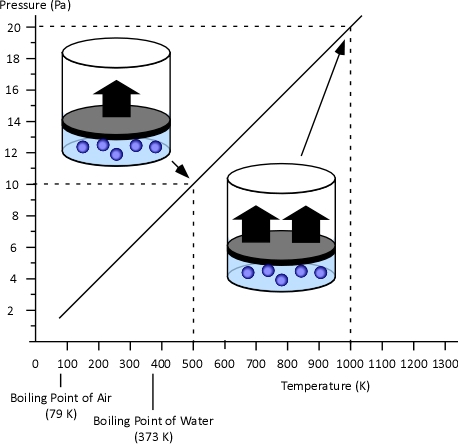
Gay-Lussac’s Law: When Jacques Charles discovered the relationship between temperature and volume, he also discovered a similar relationship between temperature and pressure. However, Charles never published this discovery. Charles’s work on temperature and pressure was recreated by French chemist Joseph-Louis Gay-Lussac. Gay Lussac’s Law states that if the volume of an ideal gas is held constant, the pressure of a given amount (mass or number of molecules) of an ideal gas increases or decreases proportionally with its absolute temperature. As with Charles’s Law, Gay-Lussac’s law can be expressed mathematically as:

Where

V=Volume

P=Pressure

Figure 3. Gay-Lussac’s Law

Boyle’s Law: in the 1660s, Irish physicist Robert Boyle studied the relationship of pressure and volume of gases. Boyle discovered that as pressure on a gas was increased, its volume decreased. Boyle’s Law states that if the temperature of an ideal gas is held constant, the pressure and volume of a given amount (mass or number of molecules) of an ideal gas are inversely proportional, as pressure increases, the volume occupied by the gas decreases. Boyle’s Law can be expressed mathematically as:

Where:

V=Volume

P=Pressure

Figure 4. Boyle’s Law

General Gas Law: The General Gas Law simply integrates Charles’s, Gay-Lussac’s, and Boyle’s Laws to state that the volume of an ideal gas is proportional to the amount (number of molecules) and absolute temperature and inversely proportional to pressure. The General Gas Law can be expressed mathematically as:

Where:

V=Volume

n=Mole (mol)

T=Temperature

P=Pressure

The General Gas Law defines the amount of gas in terms of the number of molecules, measured in moles (which has nothing to do with the animal having the same name).

Mole: While related to Avogadro’s Law, the term mole as a unit of measure was conceived by German chemist Wilhelm Ostwald in 1893. Unlike liters or grams, a mole is not a unit of volume or mass, but a counting unit. A mole is defined as the quantity of anything that has the same number of particles found in 12 grams of carbon-12. As atoms and molecules are extremely small, a mole is a large number of molecules. Specifically a mole contains 602,510,000,000,000,000,000,000 (more commonly written 6.0251 x 10²³ in scientific notation) molecules of a substance. The number of moles of a substance is denoted by the letter n. In SI units, a kilogram mole (Kmol) is often used instead of the mole. A Kmol is 1000 mol or 6.0251 x 1026 molecules of a substance.

It may seem that using the mole to measure an amount of a substance makes this more complicated. After all, why not use a measure of volume such as liters or cubic meters or mass such as grams or kilograms? Chemical formula (such as H2O for water) describes the makeup of a chemical compound in terms of the numbers of atoms of each element comprising a single molecule of the substance.

While not a unit of mass, moles can be related to mass (just as you can determine the mass of a dozen eggs of a given size, by multiplying the mass of one of the eggs by 12).

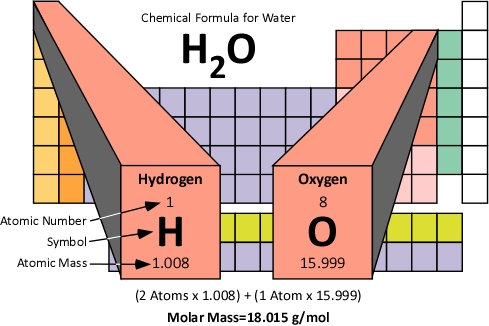
Molar Mass: The molar mass of a compound is the mass of 1.0 moles of the substance in grams. Molar mass is determined by the sum of the standard atomic weights of the atoms which form the compound multiplied by the molar mass constant (Mu) of 1 g/mol. Figure 5 illustrates how the molar mass of water is calculated.

Figure 5. Molar Mass of Water

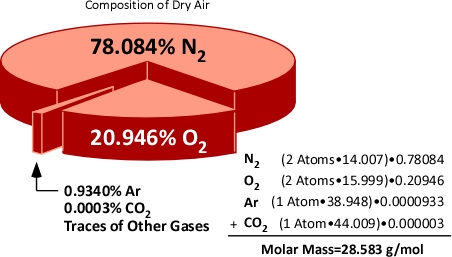
Molar mass can also be calculated for mixtures of substances. When dealing with mixtures, the molar mass of each constituent is calculated and applied proportionately on the basis of the percentage of that substance in the mixture. For example air is comprised of 78% Nitrogen, 21% Oxygen, and 1% of other gases such as Argon (Ar) and Carbon Dioxide (CO2). Nitrogen (N2) and Oxygen (O2) molecules are each comprised of two atoms (and are referred to as diatomic molecules). This means that the molar mass of Nitrogen and Oxygen molecules is twice the atomic mass.

Figure 6. Molar Mass of Air

Hopefully how the concepts of the mole and molar mass can be applied will become clear after examining the expansion of water when turned to steam and application of the gas laws to integrate steam expansion and changes in volume of the upper layer during gas cooling under a variety of circumstances.

Avogadro’s Law: In 1811, Italian physicist and mathematician Amedeo Avogadro published a theory regarding the relationship of the number of molecules in a gas if temperature, pressure, and volume are held constant. Avogadro’s Law states that samples of ideal gasses, at the same absolute temperature, pressure and volume, contain the same number of molecules regardless of their chemical nature and physical properties. More specifically, at a temperature of 273 K (0oC) and absolute pressure of 101300 Pa, 22.41 L (0.001 m3) of an ideal gas contains 6.0251 x 10²³ molecules (1.0 mol)

Ideal Gas Law: This gas law integrates Avogadro’s law with the Combined Gas Law. If the number of molecules in a specific volume of an ideal gas at a consistent temperature and pressure (273 K and 101300 Pa) is always the same, then the proportional relationship between pressure, volume, temperature, and amount can be defined as having a constant value (Universal Gas Constant).

Where:

P=Pressure (Pa)

V= Volume (m3)

T=Temperature (K)

n=Moles

Ru=Universal Gas Constant (8.3145 J/mol K)

Universal Gas Constant (Ru): This physical constant identifies the internal kinetic energy per mole of an ideal gas for each Kelvin of temperature (J/mol K). As it is universal this constant is the same for all gases that demonstrate the properties of an ideal gas.

If the pressure, volume, and temperature of an ideal gas can be observed and Avogadro’s Law is accepted as being true (making the amount of gas also known), the value of the Universal Gas Constant can be determined empirically (based on observation) by solving the ideal gas law equation for Ru.

Where:

V=Volume

Ru=Universal Gas Constant

n=Moles

T=Temperature

P=Pressure

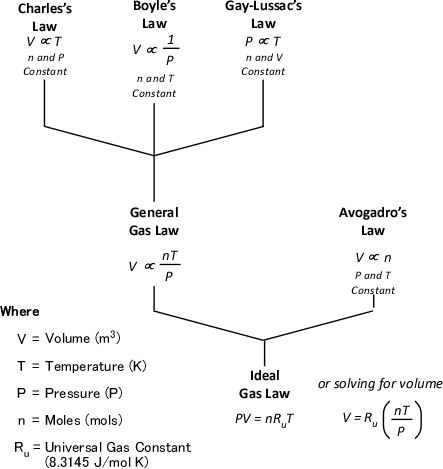
Figure 7 illustrates each of the gas laws and how they are integrated into the Ideal Gas Law.

Figure 7. Gas Laws

Application-Steam Expansion

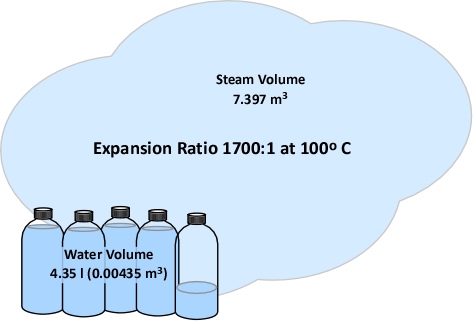
As stated in Gas Cooling: Part 3, the 5th Edition of the Essentials of Firefighting (IFSTA, 2008) states that the volume of water expands 1700 times when it is converted to steam at 100o C (212o F). However, this information is presented as a fact to be memorized and no explanation is provided as to why this is the case or that if temperature is increased further, that the volume of steam will continue to expand. In the previous post, I asked the reader to accept this assumption with assurance that an explanation would follow. Application of the ideal gas law to expansion of steam provides an excellent opportunity to exercise your understanding of the gas laws and other scientific concepts presented in this post.

What we know:

  • Molecular Mass of Water: 18 g/mol
  • Boiling Point of Water at Atmospheric Pressure: 100o C (373.15 K)
  • Density of Water at 20o C (293.15 K): 1000000 g/m3
  • Atmospheric Pressure: 101325 Pa
  • Ideal Gas Constant (Ru): 8.3145 J/mol K

What we need to find out:

  1. What is the volume of 1 mole of steam
  2. What is the density (mass per unit volume) of steam at 100o C
  3. What is the ratio between the density of water and the density of steam at 100o C

The volume of 1 mole of pure steam can be calculated by solving the ideal gas equation for V.

As 1 mole of water (in the liquid or gaseous phase) contains the same number of molecules, it’s molar mass will be the same. 1 mole of water has a mass of 18 grams. Density is calculated by dividing mass by volume, so the density of steam at 100o C can be calculated as follows:

Dividing the density of water by the density of steam at 100o C determines the expansion ratio when a specific mass of water is vaporized into steam at this temperature.

This means that if a specific mass of water is vaporized into steam at 100o C, its volume will expand 1700 times. So the 5th Edition of the Essentials of Firefighting (IFSTA, 2008) is correct, but now you know why. However, what would happen if the steam continued to absorb energy from the upper layer and its temperature increased from 100o C to 300o C, the mass of the steam would remain the same, but what would happen to the volume? You can use the Ideal Gas Law to solve this question as well.

The Next Step

Just as the Ideal Gas Law can be used to determine the expiation ratio of steam, it can also be used to calculate contraction of the upper layer as it is cooled. The next post will examine how Dr. Stefan Särdqvist integrates these two calculations to determine changes in the volume of the upper layer under a variety of conditions.

New Book

Greg Gorbett and Jim Phar of Eastern Kentucky University (EKU) have written a textbook titled Fire Dynamics focused on meeting the Fire and Emergency Services Higher Education (FESHE) curriculum requirements for Fire Behavior and Combustion. I just received my copy and at first glance it appears to be an excellent work (as I would expect from these outstanding fire service educators). One useful feature of the text is a basic review of math, chemistry, and physics as it relates to the content of the course. I will be dong a more detailed review of the book in a subsequent post, but wanted to give readers of the CFBT-US Blog a heads up that it had been released.

Ed Hartin, MS, EFO, MIFireE, CFO

References

International Fire Service Training Association (IFSTA). (2008). Essentials of firefighting (5th ed). Stillwater, OK: Fire Protection Publications.

Särdqvist, S. (2002) Water and other extinguishing agents. Karlstad, Sweden: Räddnings Verket

Gas Cooling: Part 3

September 5th, 2010

The first post in this series, Gas Cooling, began the process of providing a conceptual explanation of the fire control technique of gas cooling. As previously discussed, gas cooling reduces the hazards presented by the upper layer in a compartment fire by cooling hot gases and reducing the potential that they will ignite. Water is an effective fire control agent for this purpose because a tremendous amount of energy is required to raise its temperature and vaporize it at its boiling point.

Gas Cooling: Part 2 identified the amount of water that is theoretically necessary to cool the upper layer of a compartment containing 40 m3 (4 m wide  x 5 m long x 2 m deep) from 500o C (932o F) to 100o C (212o F). In addition, this post identified practical limitations with the efficiency of typical combination nozzles used and determined the duration of application necessary to cool the upper layer to 100o C (212o F) at different flow rates.

This raises the question, what would happen if you didn’t apply sufficient water to cool the upper layer to 100o C (212o F)?

What If?

Steam continues to absorb energy if its temperature is increased above 100o C (212o F). Some firefighters are under the impression that you cannot have steam at a temperature above 100o C (212o F) at normal atmospheric pressure. This is incorrect. Water (in liquid form) will not increase above 100o C (212o F) as this is it’s boiling point at normal atmospheric pressure, but steam acts as any other substance in the gaseous form and can increase in temperature beyond that which it changed phase from liquid to gas.

Figure 1. Properties of Water, Steam, & Smoke

Properties of Water, Steam, and Smoke

1 100 kg/M3 =1 kg/l

2 Not applicable as smoke and steam are in the gas phase

3 TCC is based on heating water from 20o C to 100o C and conversion to steam

4 Steam will continue to absorb energy until reaching temperature equilibrium

As illustrated in Figure 1, a kilogram of steam (slightly under 1.69 m3 at 100o C) will absorb 2.0 kJ of energy for each oC that the temperature of the steam is increased. The temperature of steam will continue to increase as long as the surrounding gases and/or surfaces that it is in contact with are of higher temperature. This process will continue until the steam, gases, and surfaces that the steam is in contact with reach equilibrium (i.e., the same temperature).

So even if insufficient water is applied to lower the temperature of the upper layer to 100o C (as described in Gas Cooling: Part 2 [LINK]), the combined effects of heating and vaporizing the water (the major cooling mechanism) and heating the steam produced to a temperature higher than 100o C (212o F), can have a significant cooling effect. This effect is often sufficient to extinguish flames in the upper layer and slow or reduce pyrolysis caused by heating of fuel packages due to radiative and conductive heat transfer from the flames and hot gases in the upper layer.

Gas Laws

When water as a liquid is vaporized to form steam, it expands and becomes less dense. Fire service texts such as the 5th Edition of the Essentials of Firefighting (IFSTA, 2008) commonly state that the volume of water expands 1700 times when it is converted to steam at 100o C (212o F). These texts state this as a fact to be memorized, but do not explain why this is the case or that if temperature is increased further, that the volume of steam will continue to expand. While having a number of different characteristics as illustrated in Figure 1, steam and smoke are both in the gas phase, they behave somewhat similarly. In chemistry and physics, the behavior of gases is described by a number of physical laws collectively described as the gas laws. Understanding the gas laws provides an explanation of why smoke and the steam produced during firefighting operations behave the way in which they do.

While gases have different characteristics and properties, behavior of gases can be described in general terms using the ideal gas law. This physical law describes the relationship between absolute temperature, volume, and pressure of a given amount of an ideal gas.

Figure 2. Temperature, Volume, Pressure & Amount

The concept of an ideal gas is based on the following assumptions:

  • Gases consist of molecules in random motion
  • The volume of the molecules is negligible in comparison to the total volume occupied by the gas
  • Intermolecular forces (i.e., attractive forces between molecules) are negligible
  • Pressure is the result of gas molecules colliding with the walls of its container

The ideal gas law is actually a synthesis of several other physical laws that each describes a single characteristic of the behavior of gases in a closed system (enclosed in some type of container). Of these gas laws, Charles’s Law provides the simplest explanation of the phenomena that occur during gas cooling.

Charles’s Law: In the 1780s, French scientist Jacques Charles studied the effect of temperature on a sample of gas at a constant pressure. Charles found that as the gas was heated, the volume increased. As the gas was cooled, the volume decreased. This finding gave rise to Charles’s Law which states that at a constant pressure the volume of a given amount (mass or number of molecules) of an ideal gas increases or decreases in direct proportion with its absolute (thermodynamic) temperature. The symbol  is used to express a proportional relationship (much the same as = is used to express equality), so this relationship can be expressed as:

Where:

V=Volume

T=Temperature

When two values (such as volume and temperature in Charles’s Law) are proportional, one is a consistent multiple of the other. For example If one value was consistently eight times the other, the values would also be proportional. In the case of Charles’s Law when the absolute temperature of a gas doubles, the pressure doubles. Figure 3 illustrates the relationship between absolute temperature in Kelvins (K) and volume in cubic millimeters (mm3).

Figure 3. Charles’s Law

This relationship can also be stated using the following equation:

Where

V=Volume

T=Temperature

Subscript of 1 refers to initial conditions

Subscript of 2 refers to final conditions

It is important to remember that absolute temperature is measured in Kelvins (K), not degrees Celsius or Fahrenheit, because the Kelvin scale places the zero point at absolute zero, so that doubling the temperature in K, is actually doubling the temperature. As illustrated in Figure 4, the same does not hold true when using the Celsius scale (the Fahrenheit scale presents the same problem).

Figure 4. Absolute Temperature

Application of Charles’s Law provides a simple approach to examining the question of why application of water into the upper layer does not necessarily result in an increase to upper layer volume (by adding steam) and increasing its thickness (with the bottom of the layer moving closer to the floor). This requires the assumption that while the higher temperature inside the fire compartment results in increased pressure, this increase is fairly small and does not have an appreciable outcome on volume changes during gas cooling.

As a first step in answering the question, consider what is known at this point (as illustrated in Figure 5):

  • The initial volume of the upper layer (Vu1) is 40 m3.
  • The initial temperature of the upper layer (Tu1) is 500o C (932o F)
  • The ending temperature of the upper layer (Tu2) is 100o C (212o F)

The answer we are in search of is the ending volume of the upper layer (Vu2), the volume of fire gases (Vfg) plus the volume of steam produced (Vst) during application of water for gas cooling.

Figure 5. Compartment Temperature and Volume

Expanding Steam

As discussed in Gas Cooling: Part 2 [LINK], 4.35 kg (4.35 l) of water must be vaporized in the upper layer in order to lower the temperature to 100o C (212o F). The volume of water in liters must be converted to cubic meters (the same units of measure used for the volume of the compartment and upper layer). A liter is 0.001 m3, so 4.35 l equals 0.00435 m3. For now, we will accept that conversion of water to steam results in a 1700:1 expansion ratio (a later post in this series will explain why). With an expansion ratio of 1700:1, 0.00435 m3 of water expands to 7.395 m3 of steam at 100o C (212o F) (see Figure 6)

Figure 6. Expansion of Steam at 100o F

Figure 7 illustrates the volume of steam produced when 4.35 l of water is vaporized in the upper layer of the example compartment relative to the initial volume of the upper layer.

Figure 7. Steam Expansion in a Compartment

Contracting Upper Layer

Why doesn’t the 7.397 m3 of steam that results from vaporization of the 4.35 liters of water applied for gas cooling simply increase the volume of the upper layer by 7.397 m3? Charles’s law provides the key. Charles’s Law indicates that as a gas is heated its volume will increase in direct proportion to the increase in its absolute temperature. However, the reverse is also true. The volume of a gas will decrease in direct proportion to the decrease in its absolute temperature.

Cooling the upper layer from 500o C (932o F) to 100o C (212o F) results in a 52% decrease in absolute temperature from 773 K to 373 K. The volume of the upper layer which was initially 40 m3 is reduced in direct proportion to the reduction in absolute temperature.

The volume of the upper layer (fire gases) after cooling from 500o C (932o F) to 100o C (212o F) can be calculated by solving for Vu2:

Reduction in temperature from 500o C (932o F) to 100o C (212o F) results in reduction of the volume of fire gases from 40m3 to 19.3 m3 as illustrated in Figure 8.

Figure 8. Contraction of the Upper Layer

Putting it All Together

If the water applied to cool the upper layer expands to form 7.395 m3 of steam and the final volume of the cooled upper layer is 19.3 m3, the total upper layer volume is 26.95 m3.

Figure 8. Total Upper Layer Volume

<

Dividing the Total Upper Layer Volume (Vu2) of 26.95 m3 by the area of the compartment (20 m2) determines the depth of the upper layer as being 1.347 m. Therefore, cooling the upper layer from 500o C (932o F) to 100o (212o F) C will cause the bottom of the upper layer to rise 0.6525 m (2.1’).

The Short Answer

The following points summarize the last three posts dealing with gas cooling as a fire control technique:

  • The volume of water required to cool the upper layer is quite small due to its specific heat and latent heat of vaporization in its liquid form and the specific heat of steam.
  • The expansion ratio of steam at 100o C (212o F) is 1700:1, but as the volume of water used to cool the upper layer is small, the expanded volume is still relatively small (in comparison to the contraction of the upper layer).
  • In the process of reaching equilibrium, the temperature of the upper layer is reduced to a greater extent than the temperature of the water increases due to the cooling capacity of the water and the relatively low specific heat of fire gases and air.
  • The large temperature drop in the upper layer results in a proportional reduction in volume (which works out be greater than the increase in volume resulting from the expansion of steam from water vaporized in the hot gas layer for cooling).

Based on each of these factors, a small amount of water can cool the upper layer and reduce its volume, resulting in the lower boundary of the upper layer rising as its depth decreases.

A Few Little Wrinkles!

The preceding example may conflict with your personal experience. Many of us have been in a hot, smoke filled compartment and had steam and smoke bank down on top of us after application of water. Why might this be the case?

The outcome of the preceding example depends on all of the water being vaporized while traveling through the upper layer. In this case, energy to vaporize the water is transferred from the hot gases in the upper layer, cooling the layer and causing it to contract. If the water passes through the upper layer without vaporizing, the temperature of the upper layer is not reduced and it does not contract. Water vaporizing on contact with hot compartment linings results in the steam produced being added to the volume of the upper layer. This steam cools the upper layer to some degree, but far less than using the energy of the hot gases to vaporize the water as it passes through the upper layer (compare the specific heat of steam to the specific heat and latent heat of vaporization of water in Figure 1).

When applying water fog into the upper layer, some of the water vaporizes as it travels through the hot gases and some reaches the compartment linings. Determining changes in the volume of the upper layer under these conditions is a bit more complex and requires a deeper examination of the gas laws.

Continuing the Discussion

The next post in this series will examine the other gas laws that lead to the development to the Ideal Gas Law and how this law can be used to answer questions about changes in upper layer volume as a result of gas cooling under a variety of different conditions.

Spanish Translation of Effective and Efficient Fire Streams

Thanks to Firefighters Tomá Ricci and Martín Comesaña from San Martín de Los Andes, Argentina for translating the series of posts on Fire Stream Effectiveness and Efficiency into Spanish. They can be downloaded in PDF format:

Ed Hartin, MS, EFO, MIFireE, CFO

References

International Fire Service Training Association (IFSTA). (2008). Essentials of firefighting (5th ed). Stillwater, OK: Fire Protection Publications.

Gas Cooling: Part 2

August 22nd, 2010

In a compartment fire, the upper layer can present significant hazards to firefighters, including potential for ignition and energy transfer). My last post, Gas Cooling, began an examination of the science behind gas cooling, application of water fog into the upper layer to reduce the potential for ignition and thermal hazards presented by the hot gases.

Figure 1. Energy Transfer Required for Cooling

With a specific heat of 4.2 kJ/kg and latent heat of vaporization of 2260 kJ/kg, it takes considerable energy to raise the temperature of water to its boiling point of 100o C and change it from liquid to gas phase steam. Smoke on the other hand has a specific heat of 1.0 kJ/kg, indicating that in comparison with water; much less energy is required to change its temperature. As explained in Gas Cooling, 11.3 MJ must be transferred from the upper layer of this compartment to water applied for cooling in order to lower the temperature of the upper layer in a compartment from 500o C to 100o C (see Figure 1). It is important to remember that the energy required to cool the upper layer is dependent on the mass of hot smoke and air in the upper layer. This value will vary with the size of the compartment and the temperature of the hot gases.

When starting out on this examination of gas cooling, we posed two questions:

  • How much water is required to cool the upper layer from 500o C to 100o C?
  • Why doesn’t the volume of the upper layer increase when water applied to cool the hot gases is turned to steam?

The answers to these questions are interrelated. First, let’s look at the amount of water required.

Water Required for Cooling

When water is applied for fire control and extinguishment, energy is transferred from materials that have a temperature higher than that of the water to raise the temperature of the water and to change it from liquid phase to gas phase.

The theoretical cooling capacity (TCC) of water is 2.6 MJ/kg. This value is based on heating a kilogram of water from 20o C to 100o C (0.3 MJ/kg) and vaporizing it completely into steam (2.3 MJ/kg).

Dividing the energy that must be transferred from the upper layer by the TCC calculates the amount of water that would theoretically be required to cool the upper layer from 500o C to 100o C if the energy transfer and conversion of water to steam was 100% efficient. If this was the case, the upper layer could be cooled to 100o C by applying 4.35 kg of water. Given the density of water at 20o C of approximately 1.0 kg/l, this would be a volume of approximately 4.35 liters. However, this assumes instantaneous heat transfer and 100% efficiency in conversion of water to the gas phase. Neither of which is possible in the real world!

Experimental data (Hadjisophocleous & Richardson, 2005; Särdqvist, S., 1996) has shown that the cooling efficiency of water in both laboratory experiments and actual firefighting operations ranges from 0.2 to 0.6. Särdqvist (1996) suggests that an efficiency factor of 0.2 be used for interior fog nozzles. Barnett (as cited in Grimwood, 2005) suggests that an efficiency factor of 0.5 be used for solid or straight stream application and 0.75 for fog application. In actuality, the efficiency of water application varies considerably with the design of the nozzle, skill of the nozzle operator, and a range of other factors. For our examination of gas cooling, we will use an efficiency factor of 0.6 (60%).

Multiplying the TCC of water by 0.6 adjusts the cooling capacity to account for the fact that some of the water applied into the hot gas layer will not turn to steam while passing through the hot gas layer. Some of the droplets will pass through the gas layer and vaporize on contact with hot surfaces (more on this later) and others will fall to the floor, with increased temperature, but remaining in liquid form.

Figure 2. Adjusted Cooling Capacity of Water

Dividing the 11.3 MJ of energy that must be transferred from the upper layer of the compartment by an Adjusted Cooling Capacity (ACC) of 1.56 MJ/kg determines that 7.2 kg (7.2 liters) of water are required to lower its temperature from 500o C to 100o C.

Figure 3 illustrates common flow rates from combination nozzles, Adjusted Cooling Capacity (ACC) and time required to apply the 7.2 kg of water necessary to cool the upper layer of the compartment from 500o C to 100o C.

Figure 3. Flow Rate, Adjusted Cooling Capacity, and Application Duration

As illustrated in Figure 3, if water is applied at 115 l/min (30 gal/min), several short pulses will provide sufficient water application. If the flow rate is increased to 230 l/min, a single pulse is likely to be sufficient. However, if the flow rate is increased further, it is likely that excessive water will be applied. In addition, droplet size increases with flow rate, reducing efficiency.

All Models are Wrong!

This examination of gas cooling provided a simple example of how much water is required to cool the upper layer in a given compartment. While this explanation provides a good way to understand how gas cooling works, it is incomplete. Box and Draper (1987, p. 424)observe that “all models are wrong, but some are useful”. The following factors add quite a bit of complexity to examination of gas cooling:

  • The energy that must be transferred from the upper layer is dependent on the mass of the hot gases and their temperature.
  • Not all of the water applied vaporizes in the upper layer (some droplets travel through the hot gases and vaporize on contact with hot surfaces and others drop to the floor without completely vaporizing).
  • Temperature of the hot gases in the upper layer is not uniform (as assumed in two layer models).
  • Ongoing combustion and energy transfer from hot compartment linings add energy to the hot gas layer.
  • Convection and gravity current influence the movement of hot and cool gases, making conditions dynamic rather than static.

While our model of gas cooling is wrong, I believe that it is useful. Firefighters do not calculate the volume of water required to cool the hot gas layer on the fireground. However, it is important to understand how flow rate and duration impact on effectiveness and efficiency.

Important!

Remember that this example involved gas cooling in a single compartment with static conditions. The flow rate and/or duration of application for fires in larger compartments or direct attack on burning fuel may be quite different.

What’s Next?

One question remains in our examination of gas cooling. Why doesn’t the volume of the upper layer increase when water applied for gas cooling turns to steam? This will be the focus of the third post in this series.

Ed Hartin, MS, EFO, MIFireE, CFO

References

Box, G. & Draper, R (1987). Empirical Model-Building and Response Surfaces. New York: Wiley.

Hadjisophocleous, G.V. & Richardson, J.K. (2005). Water flow demands for firefighting. Fire Technology 41, p. 173-191.

Särdqvist, S. (1996) An Engineering Approach To Fire-Fighting Tactics Sweden, Lund University, Department of Fire Safety Engineering

Svennson, S. (2002). The operational problem of fire control (Report LUTVDG/TVBB-1025-SE). Sweden, Lund University, Department of Fire Safety Engineering.

Grimwood, P. (2005). Firefighting Flow Rate: Barnett (NZ) – Grimwood (UK) Formulae. Retrieved January 26, 2008 from http://www.fire-flows.com/FLOW-RATE%20202004.pdf