Townhouse Fire: Washington, DC:
Computer Modeling
Monday, September 28th, 2009
This post continues study of an incident in a townhouse style apartment building in Washington, DC with examination of the extreme fire behavior that took the lives of Firefighters Anthony Phillips and Louis Mathews.
A Quick Review
Prior posts in this series, Fire Behavior Case Study of a Townhouse Fire: Washington, DC, Townhouse Fire: Washington, DC-What Happened,and Townhouse Fire: Washington, DC-Extreme Fire Behavior examined the building and initial tactical operations at this incident. The fire occurred in the basement of a two-story, middle of building, townhouse apartment with a daylight basement. This configuration provided at grade entrances to Floor 1 on Side A and the Basement on Side C.
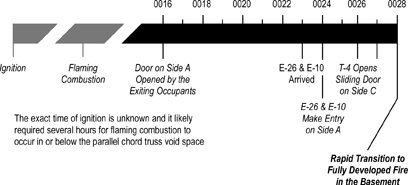
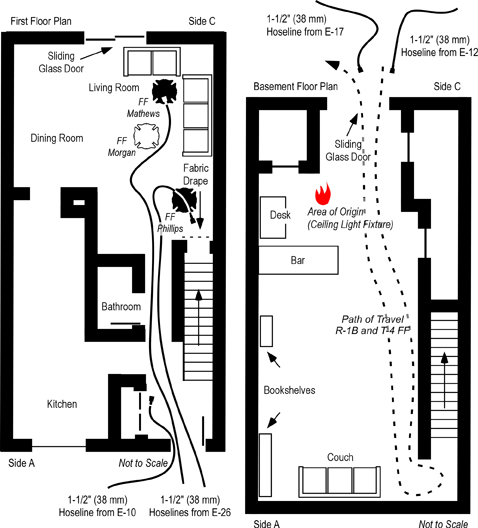
Engine 26, the first arriving unit reported heavy smoke showing from Side A and observed a bi-directional air track at the open front door. Engines 26 and 10 operating from Side A deployed hoselines into the first floor to locate the fire. Engine 17, the second due engine, was stretching a hoseline to Side C, but had insufficient hose and needed to extend their line. Truck 4, the second due truck, operating from Side C opened a sliding glass door to the basement to conduct search and access the upper floors (prior to Engine 17’s line being in position). When the door on Side C was opened, Truck 4 observed a strong inward air track. As Engine 17 reached Side C (shortly after Rescue 1 and a member of Truck 4 entered the basement) and asked for their line to be charged. Engine 17 advised Command that the fire was small.
Conditions changed quickly after the door on Side C was opened, as conditions in the basement rapidly transitioned to a fully developed fire with hot gases and flames extending up the interior stairway trapping Firefighters Phillips, Mathews, and Morgan. Confusion about building configuration (particularly the number of floors and location of entry points on Side A and C) delayed fire attack due to concern for opposing hoselines.
Modeling of the Cherry Road Incident
National Institute for Standards and Technology (NIST) performed a computer model of fire dynamics in the fire at 3146 Cherry Road (Madrzykowski and Vettori, 2000) using the NIST Fire Dynamics Simulator (FDS) software. This is one of the first cases where FDS was used in forensic fire scene reconstruction.
Fire Modeling
Fire modeling is a useful tool in research, engineering, fire investigation, and learning about fire dynamics. However, effective use of this tool and the information it provides requires understanding of its capabilities and limitations.
Models, such as the National Institute of Standards and Technology (NIST) Fire Dynamics Simulator (FDS) relay on computational fluid dynamics (CFD). CFD models define the fire environment by dividing it into small, rectangular cells. The model simultaneously solves mathematical equations for combustion, heat transfer, and mass transport within and between cells. When used with a graphical interface such as NIST Smokeview, output can be displayed in a three-dimensional (3D) visual format.
Models must be validated to determine how closely they match reality. In large part this requires comparison of model output to full scale fire tests under controlled conditions. When used for forensic fire scene reconstruction, it may not be feasible to recreate the fire to test the model. In these situations, model output is compared to physical evidence and interview data to determine how closely key aspects of model output matched events as they occurred. If model output reasonably matches events as they occurred, it is likely to be useful in understanding the fire dynamics involved in the incident.
It is crucial to bear in mind that fire models do not provide a reconstruction of the reality of an event. They are simplified representation of reality that will always suffer from a certain lack of accuracy and precision. Under the condition that the user is fully aware of this status and has an extensive knowledge of the principles of the models, their functioning, their limitations and the significance attributed to their results, fire modeling becomes a very powerful tool (Dele´mont & Martin, J., 2007, p. 134).
FDS output included data on heat release rate, temperature, oxygen concentration, and velocity of gas (smoke and air) movement within the townhouse. As indicated above, model output is an approximation of actual incident conditions.
In large scale fire tests (McGrattan, Hamins, & Stroup, 1998, as cited in Madrzykowski and Vettori, 2000), FDS temperature predictions were found to be within 15% of the measured temperatures and FDS heat release rates were predicted to within 20% of the measured values. For relatively simple fire driven flows such as buoyant plumes and flows through doorways, FDS predictions are within experimental uncertancies (McGrattan, Baum, & Rehm, 1998, as cited in Madrzykowski and Vettori, 2000).
Results presented in the NIST report on the fire at 3146 Cherry Road were presented as ranges to account for potential variation between model output and actual incident conditions.
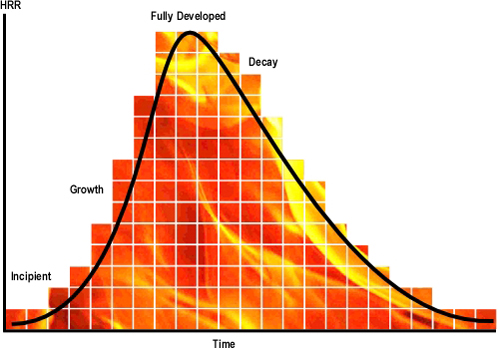
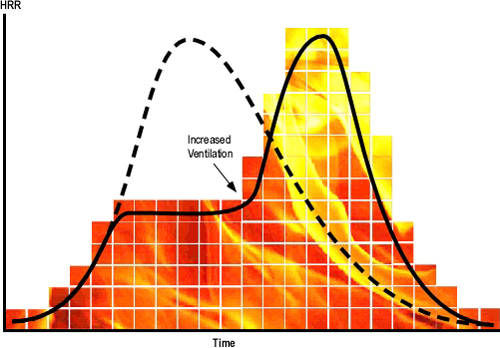
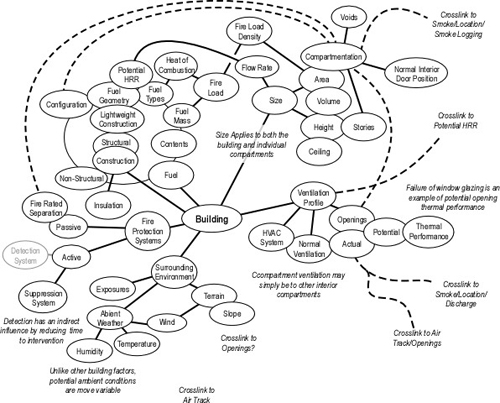
Heat release rate is dependent on the characteristics and configuration of the fuel packages involved and available oxygen. In a compartment fire, available oxygen is dependent on the ventilation profile (i.e., size and location of compartment openings). The ventilation profile can change over time due to the effects of the fire (e.g., failure of window glazing) as well as human action (i.e., doors left open by exiting occupants, tactical ventilation, and tactical anti-ventilation)
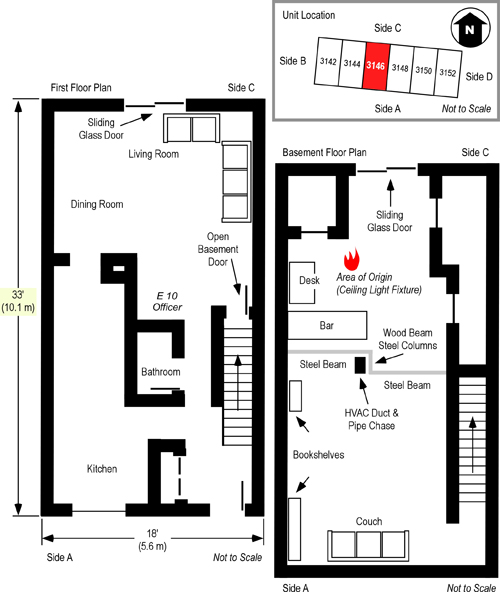
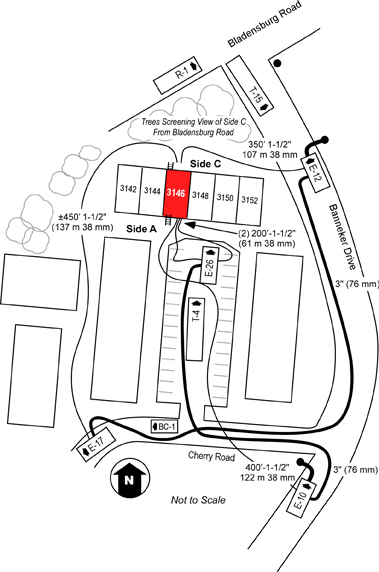
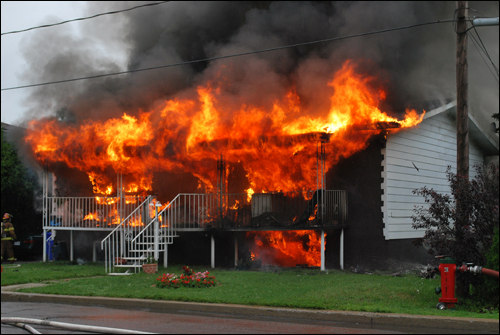
In this incident there were a number of changes to the ventilation profile. Most significant of which were, 1) the occupant opened the second floor windows on Side C (see Figure 3), 2) the occupant left the front door open as they exited (see Figures 1 &2 ), 3) tactical ventilation of the first floor window on Side A, and opening of the sliding glass door in the basement on Side C (see Figures 1-3). In addition, the open door in the basement stairwell and open stairwell between the Floors 1 and 2 also influenced the ventilation profile (see Figure 1).
Figure 1. Cross Section of 3146 Cherry Road NE
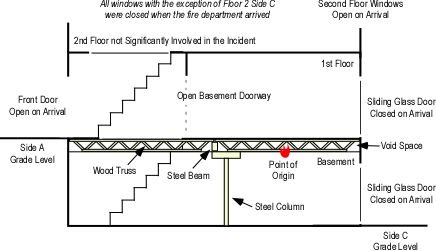
Figure 2. Side A 3146 Cherry Road NE
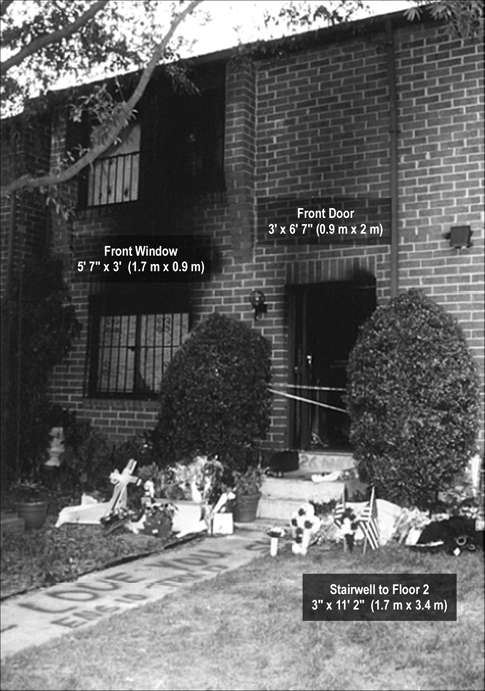
Figure 3. Side C 3146 Cherry Road NE
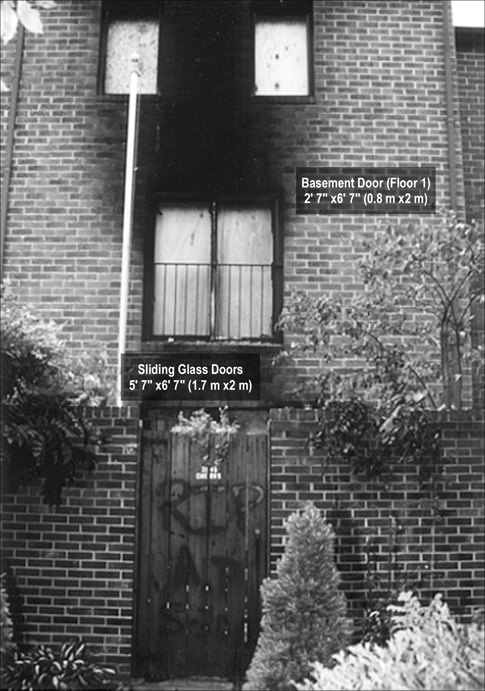
Figure 4 illustrates the timing of changes to the ventilation profile and resulting influence on heat release rate in modeling this incident. A small fire with a specific heat release rate (HRR) was used to start fire growth in the FDS simulation. In the actual incident it may have taken hours for the fire to develop flaming combustion and progression into the growth stage. Direct comparison between the simulation and incident conditions began at 100 seconds into the simulation which corresponds to approximately 00:25 during the incident.
Figure 4. FDS Heat Release Rate Curve
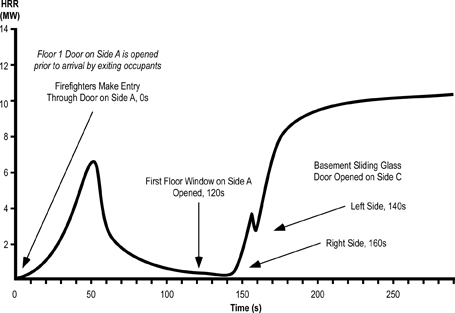
Note: Adapted from Simulation of the Dynamics of the Fire at 3146 Cherry Road NE Washington D.C., May 30, 1999, NISTR 6510 (p. 14) by Dan Madrzykowski and Robert Vettori, 2000, Gaithersburg, MD: National Institute for Standards and Technology.
Questions
The following questions are based on heat release rate data from the FDS model presented in Figure 4.
- What was the relationship between changes in ventilation profile and heat release rate?
- What would explain the rapid increase in heat release rate after the right side of the basement sliding glass door is opened?
- Why might the heat release rate have dropped slightly prior to opening of the left side of the basement sliding glass door?
- Why did the heat release rate again increase rapidly to in excess of 10 MW after the left side of the basement sliding glass door was opened?
- How does data from the FDS model correlate to the narrative description of events presented in prior posts about this incident (Fire Behavior Case Study of a Townhouse Fire: Washington, DC, Townhouse Fire: Washington, DC-What Happened,and Townhouse Fire: Washington, DC-Extreme Fire Behavior)?
More to Follow
In addition to heat release rate data the computer modeling of this incident provided data on temperature, oxygen concentration, and gas velocity. Visual presentation of this data provides a more detailed look at potential conditions inside the townhouse during the fire. The next post in this series will present and examine graphic output from Smokeview to aid in understanding the fire dynamics and thermal environment encountered during this incident.

Ed Hartin, MS, EFO, MIFireE, CFO
References
District of Columbia (DC) Fire & EMS. (2000). Report from the reconstruction committee: Fire at 3146 Cherry Road NE, Washington DC, May 30, 1999. Washington, DC: Author.
Madrzykowski, D. & Vettori, R. (2000). Simulation of the Dynamics of the Fire at 3146 Cherry Road NE Washington D.C., May 30, 1999, NISTR 6510. August 31, 2009 from http://fire.nist.gov/CDPUBS/NISTIR_6510/6510c.pdf
National Institute for Occupational Safety and Health (NIOSH). (1999). Death in the line of duty, Report 99-21. Retrieved August 31, 2009 from http://www.cdc.gov/niosh/fire/reports/face9921.html


