Archive for March, 2010

Nozzle Evaluation

Sunday, March 28th, 2010

As with many other questions, it is likely that the answer to the question of which nozzle is best is it depends. As discussed in Effective and Efficient Fire Streams, Safe, effective and efficient fire control requires:

  • Water application to control the fire environment as well as direct attack on the fire
  • Appropriate flow rate for the tactical application (cooling hot, but unignited gases may be accomplished at a lower flow rate than direct attack on the fire)
  • Direct attack to exceed the critical flow rate based on the fire’s heat release rate
  • Sufficient reserve (flow rate) be available to control potential increases in heat release rate that may result from changes in ventilation
  • Water application in a form appropriate to cool its intended target (i.e., small droplets to cool hot gases or to cover hot surfaces with a thin film of water)
  • Water to reach its intended target (fog stream to place water into the hot gas layer and a straight or solid stream to pass through hot gases and flames and reach hot surfaces)
  • Control of the fire without excessive use of water

Accomplishing this requires different stream characteristics at different times. The characteristics that are optimal for gas cooling are likely quite different than for cooling hot surfaces, particularly when dealing with fully developed fire conditions in a large compartment. It is likely that direct attack on a fire with a high heat release rate in a large compartment may best be accomplished with a high flow stream having a high degree of stream cohesion and extremely large droplets. On the other hand, cooling the hot gas layer while accessing a shielded fire is most effectively and efficiently accomplished using a fog stream with a variable pattern angle, small droplet size, and a lower flow rate. No nozzle and hose system will be equally effective and efficient in all situations.

At present, there is no standardized method for testing and evaluating the effectiveness and efficiency of firefighting nozzles. However, there are a number of parameters that may be useful in the process of evaluating, selection, and specification of combination nozzles.

Application

Nozzle selection must be considered within the context of the nozzle, hose, and pump system that it will be used. If starting from scratch, it may be useful to consider each of these components. For example, high and ultra high pressure systems can provide considerably higher efficiency than low pressure systems, but they are limited to low flow rates. Low pressure systems on the other hand have larger droplet sizes and as such cannot achieve as high efficiency as higher pressure systems, but are scalable to deliver higher flow rates. If we have an existing system in place, the question may be what nozzle will provide the greatest effectiveness, efficiency, and range of capabilities.

It is also important to consider the type of buildings and occupancies in which firefighting operations will likely take place. Important factors include building and interior compartment size and occupancy. Another factor that must be considered is pressure limitations imposed by fixed fire suppression systems such as standpipes (in some cases outlet pressure is limited to 65 psi (448 kPa).

While there is no standard test methodology for determining the effectiveness and efficiency, there are a number of characteristics that can be assessed and evaluated when considering selection and specification of the handline nozzles.

Starting Point

Central Whidbey Island Fire & Rescue (CWIFR), where I serve as Fire Chief is about to start the process of evaluating nozzles for use on existing 1-3/4” (45 mm) handlines. CWIFR is a small fire district with a mix of residential and commercial occupancies located approximately 60 miles (97 km) north of Seattle, Washington. Structural fire risks are predominantly wood frame, single family dwellings with a small number of apartments, commercial buildings and institutional occupancies. The district protects an area of 50 square miles and a population of approximately 9000. Four Type I Engines and three Type I Tactical Water Tenders are staffed with a mix of full-time, part-time, and volunteer personnel operating out of four fire stations.

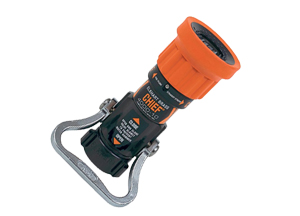
CWIFR currently uses Elkhart Chief 150 g/min (568 l/min) single flow rate nozzles that are designed to operate at a nozzle pressure of 75 psi (517 kPa) as the standard nozzle on 1-3/4” (45 mm) hoselines (similar to the nozzle shown in Figure 1, but CWIFR uses break apart nozzles with a separate tip and shutoff).

Figure 1. Elkhart Chief Nozzle
elkhart_chief

Given the same flow rate, a nozzle pressure of 75 psi provides a slight reduction in nozzle reaction in comparison with a nozzle pressure of 100 psi (about 13% when operating a straight stream). However, all things being equal, lower nozzle pressure generally results in larger droplets. Larger droplet size is not necessarily a disadvantage in direct or indirect attack, but can significantly reduce effectiveness of gas cooling. Using the current CWIFR nozzles, flow rate can be increased to approximately 180 gpm by increasing nozzle pressure to 100 psi. However, it is not possible to develop effective streams at flow rates significantly below 150 gpm as a nozzle pressure below 75 psi causes significant deterioration in stream quality, reach, and penetration.

CWIFR’s nozzle tests will serve several purposes: First will be to increase members’ familiarity with the nozzles currently in use, their capabilities, and limitations. The second will be to evaluate other types of nozzles that may provide a broader range of capabilities and increase operational effectiveness.

Three variable flow nozzles and two automatic nozzles will be included in the initial round of testing and evaluation. All of the nozzles selected allow for development of a range of flows at a standard nozzle pressure of 100 psi.

Variable Flow Nozzles

  • Akron Turbojet
    30-60-95-125 g/min (115-230-360-475 l/min)
  • Akron Wide Range Turbojet
    Flow Range 30-95-125-150-200 g/min (115-360-475-550-750 l/min)
  • Elkhart Wide Range Phantom
    Flow Range 30-95-125-150-200 g/min (115-360-475-550-750 l/min)

Automatic Nozzles

  • Ultimatic 10-125 g/min (38-475 l/min)
  • Midmatic 70-200 g/min (265-750 l/min)

Three of these nozzles, the Wide Range Turbojet, Wide Range Phantom, and Midmatic have a higher designed flow capability than the nozzles currently used by CWIFR as well as the capability to develop effective streams at lower flow rates. Two of these nozzles, the Turbojet and Ultimatic have a lower flow capability than the nozzles currently used by CWIFR, but have been found to provide excellent gas cooling capability based on laboratory tests (Handell, 2000) and anecdotal evidence during live fire training and operational firefighting.

Basic Design

The starting point for nozzle evaluation is identification of basic characteristics:

  • Designed Nozzle Pressure
  • Flow Control: Fixed Flow, Variable Flow, Automatic
  • Flow Rates/Range

Physical & Operational Characteristics

Physical and operational characteristics can be as important as stream performance as nozzles must be used under a wide range of operational conditions.

  • Weight
  • Size
  • Size of Bail
  • Flow Control Method
  • Simplicity/Complexity of Operation

Performance Characteristics

Nozzle performance can be evaluated in a variety of different ways ranging from baseline data such as actual flow rates, range of patterns developed, and ease of operation. Other characteristics are a bit more complex such as pattern density and hang time.

  • Actual flow rate vs. specified flow rate
  • Maximum fog pattern angle
  • Reach at designed pressure and flow
  • Ease of Operation within designed pressure and flow range
  • Pattern density during continuous operation
  • Pattern density after pulsed application (2 second delay)
  • Hang time for droplets in pulsed application
  • Performance (as outlined above) outside designed pressure and flow

As identified above, performance will also be evaluated outside the designed pressure and flow range of the nozzles. For example, use of variable flow nozzles at the lowest flow setting at pressures above the designed nozzle pressure can produce extremely small droplets (more on this in a later post).

Finance and Logistical Considerations

While nozzle performance is the most important factor, it is also essential to assess the logistical and financial considerations.

  • Initial purchase price
  • Life-cycle cost
  • Maintenance requirements

Next Steps

The next post in this series will examine the nozzles currently in use by CWIFR and provide additional detail on the evaluation process.

Reference

Handell, A. (2000) Utvärdering av dimstrålrörs effektivitet vid brandgaskylning [Evaluation of the efficiency of fire fighting spray nozzles in a smoke gas cooling situation], Report  5065. Department of Fire Safety Engineering, Lund University, Sweden

Everyday Concepts:
Energy, Heat, & Temperature-Part 2

Sunday, March 21st, 2010

I am using this series of posts to work through the process of developing a chapter on the foundational scientific concepts related to practical fire dynamics and fire control theory. My hope is to take the middle ground between the oversimplified and unsupported explanations provided in most texts intended for firefighter training and the higher level materials intended for fire protection engineers. This is proving to be no small task! Your feedback on my success (or lack thereof) in providing scientifically sound, but reasonably simple explanations would be greatly appreciated.

Back to Everyday Concepts Part 1

When faced with the challenge of developing firefighters understanding of energy, temperature, heat, and power in a limited timeframe, I generally avoid detailed discussion of the actual definition of the SI unit for energy, the Joule, and the mechanical equivalent of thermal energy. I have found that illustrating the concept of the Joule as it relates to thermal energy in terms of heating water to serve the purpose. However, as I looked back at the first post in this series, I think it would be useful to go back to the source, and examine James Joule’s experiments that made the connection to the equivalence of mechanical and thermal energy.

While not commonly used in scientific work, the American fire service has typically used the British thermal unit (Btu) as a measure of thermal energy. The Btu is defined in terms of the heating effect of energy transferred to water. One Btu is the energy required to raise the temperature of one pound of water by one degree Fahrenheit.

As discussed in the first post in this series, the SI unit of measure for energy is the Joule (J) which is defined in mechanical terms, but is applicable to all forms of energy.

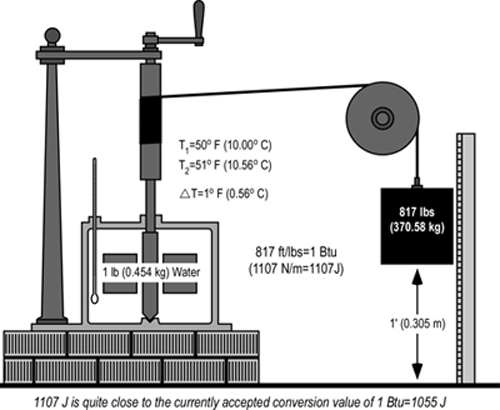
In the mid 1800’s English physicist James Joule demonstrated the equivalence of mechanical and thermal energy by using a mechanical apparatus to stir water in an insulated container with paddles driven by a falling weight (see Figure 1).

Joule (1845) reported that based on analysis of data from a number of experiments, that expenditure of mechanical energy of 817 ft/lbs (the energy required to raise 817 pounds to a height of one foot) was the equivalent of an increase in temperature of one pound of water by one degree Fahrenheit. Conversion to SI units of measure is a bit complex, but 817 ft/lbs is equal to 1107 Newton/meters (the energy required to raise a mass of 1107 N to a height of 1 meter). While a non-standard measure of energy, the Newton/meter (N/m) provides a direct comparison to ft/lbs. In mechanical terms, a N/m equals the SI unit for energy, the Joule. Expressed in SI units, 1107 Joule of energy were required to raise the temperature of 0.454 kg (1.0 lbs) of water 0.56o C (1o F). This is quite close to the currently accepted conversion value in which 1055 J = 1 Btu.

Figure 1. Demonstration of the Mechanical Equivalent of Heat

joule_apparatus_lr

Note: Joule used a lesser weight falling over a greater distance, repeated a number of times. This drawing is simplified to provide a conceptual illustration.

Heat Transfer

In everyday language the word heat is used in a variety of ways (many of which are incorrect from a thermodynamic perspective). In thermodynamics, heat is a method of energy transfer. Heat is not a form of energy (a commonly stated misconception), but simply the name of the process of energy transfer based on temperature difference. Objects do not “have” heat, they have thermal energy, and heat is thermal energy in the process of transfer to objects having a lower temperature.

Even though it involves energy transfer, heat is not the same as work. Remember that work involves force causing movement in a direction influenced by that force (and if no movement in that direction occurred, no work is done). Energy transferred by heat results in an increase in molecular movement, but not in a specific direction, therefore no work is done. However, this does not mean that energy transferred by heat cannot be transformed into mechanical energy and accomplish work.

Transfer of energy from one object to another must be classified as heat or work. When energy content changes, it must be the result of heat, work, or a combination of both. Heat and work are processes by which energy is exchanged rather than energy itself.

The word flow is often used in discussing heat transfer (e.g., energy flows from objects with higher temperature to those with lower temperature). This helps visualize patterns of movement, but it is important to remember that neither energy nor heat is a fluid. Heat is the process of energy transfer due to temperature differences. This energy transfer takes place in a variety of different ways.

Second Law of Thermodynamics: There are several ways to state this law. The simplest is that heat cannot spontaneously flow from a material at lower temperature to a material at higher temperature. However, thermal energy moves from materials at high temperature to those having lower temperatures until they have the same temperature (equilibrium).

There are three methods of heat transfer, conduction, convection, and radiation. Each of these has significant impact on the processes of combustion, fire development, and fire control.

Conduction

Conduction of heat occurs when adjacent atoms vibrate against one another or as electrons move from atom to atom. Heat transfers through solid materials and between solid materials in direct contact with one another by conduction. The atoms in liquids and gases are further apart, reducing the probability of collision and transfer of thermal energy.

Figure 2. Conduction

conduction

Factors Influencing Conductive Heat Transfer

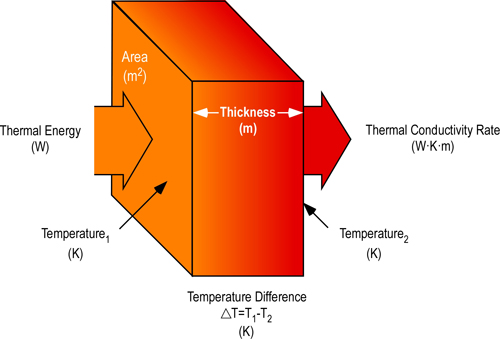
The factors influencing conduction are temperature difference, length (or thickness), cross sectional area, and the thermal conductivity of the conductor.

Thermal conductivity is the measure of the quantity of thermal energy which flows through a conductor. In addition to form, there are a number of factors influencing thermal conductivity of materials including molecular bonding, structure, and density. Units of measure for conductivity must account for the amount of energy transferred in a given amount of time, thickness (or distance), and temperature difference. The SI units of measure for thermal conductivity are Watts per Kelvin per Meter (W?K?m). While appearing to be complex, this measure is fairly straightforward; indicating the number of Watts (Joules/second) transferred a distance of one meter for each Kelvin of temperature difference (Figure 3)

Figure 3. Thermal Conductivity

thermal_conductivity_lr

When the temperature of one surface of a solid material is higher than another, heat will move through the material. Depending on the characteristics of the material, this conductive heat transfer may be slow or it may occur quickly. The rate of heat transfer is defined by the coefficient of thermal conductivity.

As illustrated in Figure 3, the total amount of heat transfer is dependent on the coefficient of thermal conductivity, difference in temperature, and cross sectional area of the conductor. It is difficult to measure thermal conductivity as it describes a semi-static situation with a constant temperature gradient. However, heat transfer results in temperature changes towards equilibrium (equal temperature at all points in the conductor).

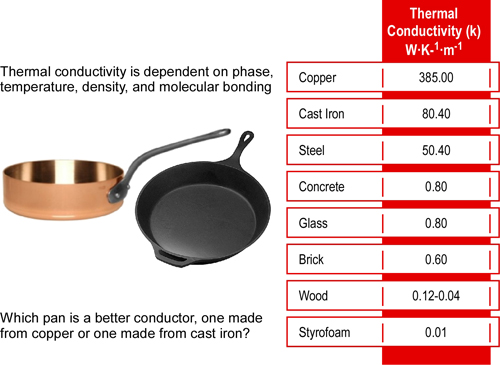
A high coefficient means heat moves very quickly; a low coefficient means heat moves very slowly. As illustrated in Table 1, the thermal conductivity constant (k) for different materials varies considerably.

Table 1Thermal Conductivity Table

thermal_conductivity_table_lr

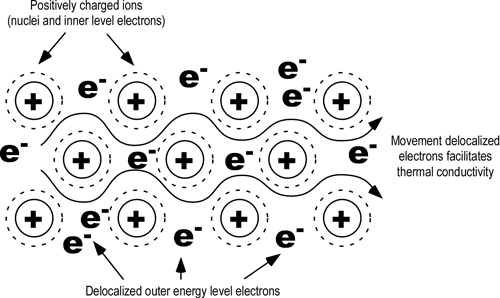
Metals are usually the best conductors of thermal energy due to their molecular bonding and structure. Metallic chemical bonds have free-moving electrons and form a crystalline structure which aids in transfer of thermal energy as illustrated in Figure 4.

Figure 4. Conduction in Metals

metal_conductivity_lr

Because the outer electrons in metals are shared by all the atoms, they are not considered to be associated with any one atom. Since these electrons are attracted to many atoms, they have considerable mobility that allows for the good thermal conductivity seen in metals.

In general, density decreases so does conduction (some unusual materials such as carbon foam, have low density and high conductivity). Therefore, most fluids (and especially gases) are less conductive. This is due to the large distance between atoms in a gas: fewer collisions between atoms means less conduction. Conduction is dependent on the area being heated, temperature differential, and thermal conductivity of the material.

What’s Next

The next post in this series will examine convection and radiation as mechanisms of heat transfer. In addition, I will be starting a series of posts to discuss a comprehensive approach for nozzle testing from an operational perspective.

Ed Hartin, MS, EFO, MIFireE, CFO

References

Joule, J. (1845). On the existence of an equivalent relation between heat and the ordinary forms of mechanical power. Philosophical Magazine, 3(xxvii), p. 205.

Chicago Extreme Fire Behavior
Analysis of Fire Behavior Indicators

Monday, March 15th, 2010

Quick Review

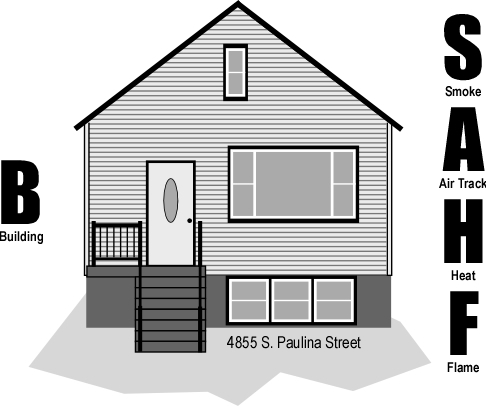
The previous post in this series presented a video clip of an incident on the afternoon of February 18, 2010 that injured four Chicago firefighters during operations at a residential fire at 4855 S. Paulina Street.

First arriving companies discovered a fire in the basement of a 1-1/2 story, wood frame, single family dwelling and initiated fire attack and horizontal ventilation of the floors above the fire. Based on news accounts, the company assigned to fire attack was in the stairwell and another firefighter was performing horizontal ventilation of the floors above the fire on Side C when a backdraft or smoke explosion occurred. Two firefighters on the interior, on at the doorway and the firefighter on the ladder on Side C were injured and were transported to local hospitals for burns and possible airway injuries.

In analyzing the video clip shot from inside a nearby building, we have several advantages over the firefighters involved in this incident.

Time: We are not under pressure to make a decision or take action.

Reduced Cognitive Workload: Unlike the firefighters who needed to not only read the fire, but also to attend to their assigned tactics and tasks, our only focus is analysis of the fire behavior indicators to determine what (if any) clues to the potential for extreme fire behavior may have been present.

Repetition: Real life does not have time outs or instant replay. However, our analysis of the video can take advantage of our ability to pause, and replay key segments, or the entire clip as necessary.

Perspective: Since the field of view in the video clip is limited by the window and the fidelity of the recording is less than that seen in real life, it presents a considerably different field of view than that of the firefighters observed in operation and does not allow observation of fire behavior indicators and tactical operations on Sides A, B, and D.

Initial Size-Up

What B-SAHF indicators could be observed on Side C up to the point where firefighters began to force entry and ventilate the basement (approximately 02:05)?

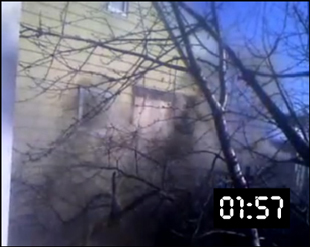
Figure 1. Conditions at 01:57 Minutes Elapsed Time in the Video Clip

0157_time

Building: The structure is a 1-1/2 story, wood frame, dwelling with a daylight basement. The apparent age of the structure makes balloon frame construction likely, and the half story on the second floor is likely to have knee walls, resulting in significant void spaces on either side and a smaller void space above the ceiling on Floor 2. One window to the left of the door on Side C appears to be covered with plywood (or similar material). Given the location of the door (and door on Side A illustrated in the previous post in this series), it is likely that the stairway to the basement is just inside the door in Side C and a stairway to Floor 2 is just inside the door on Side A.

Smoke: A moderate volume of dark gray smoke is visible from the Basement windows and windows and door on Floor 1 as well as a larger volume from above the roofline on Side B. While dark, smoke on Side C does not appear to be thick (optically dense), possibly due to limited volume and concentration while smoke above the roofline on Side B appears to be thicker. However smoke on Side C thickens as time progresses, particularly in the area of the door on Floor 1. The buoyancy of smoke is somewhat variable with low buoyancy on Side C and greater buoyancy on Side B. However, smoke from the area of the door on Floor 1 Side C intermittently has increased buoyancy.

Air Track: Smoke on Side C appears to have a faintly pulsing air track with low velocity which is masked to some extent by the effects of the wind (swirling smoke due to changes in low level wind conditions). Smoke rising above the roofline on Side B appears to be moving with slightly greater velocity (likely due to buoyancy).

Heat: The only significant heat indicators are limited velocity of smoke discharge and variations in buoyancy of smoke visible from Sides B and C. Low velocity smoke discharge and low buoyancy of the smoke on Side C points to relatively low temperatures inside the building. The greater buoyancy and velocity of smoke observed above the roofline on Side B indicates a higher temperature in the area from where this smoke is discharging (likely a basement window on Side B).

Flame: No flames are visible.

Initial Fire Behavior Prediction

Based on assessment of conditions to this point, what stage(s) of development and burning regime(s) is the fire likely to be in?

Dark smoke with a pulsing air track points to a ventilation controlled, decay stage fire.

What conditions would you expect to find inside the building?

Floors 1 and 2 are likely to be fully smoke logged (ceiling to floor) with fairly low temperature. The basement is likely to have a higher temperature, but is also likely to be fully smoke logged with limited flaming combustion.

How would you expect the fire to develop over the next few minutes?

As ventilation is increased (tactical ventilation and entry for fire control), the fire in the basement will likely remain ventilation controlled, but will return to the growth stage as the heat release rate increases. Smoke thickness and level (to floor level) along with a pulsing air track points to potential for some type of ventilation induced extreme fire behavior such as ventilation induced flashover (most likely) or backdraft (less likely). Another possibility, would be a smoke explosion; ignition of premixed gas phase fuel (smoke) and air that is within its flammable range (less likely than some type of ventilation induced extreme fire behavior)

Ongoing Assessment

What indicators could be observed while the firefighter was forcing entry and ventilating the daylight basement on Side C (02:05-02:49)?

There are few changes to the fire behavior indicators during this segment of the video. Building, Heat, and Flame indicators are essentially unchanged. Smoke above the roofline appears to lighten (at least briefly) and smoke on Side C continues to show limited buoyancy with a slightly pulsing air track at the first floor doorway.

What B-SAHF indicators can be observed at the door on Side C prior to forced entry (02:49-03:13)?

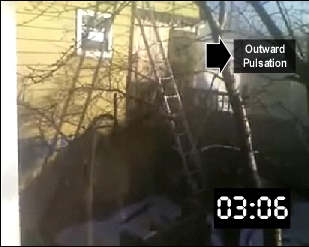
Figure 2. Conditions at 03:06 Minutes Elapsed Time in the Video Clip

0307_time

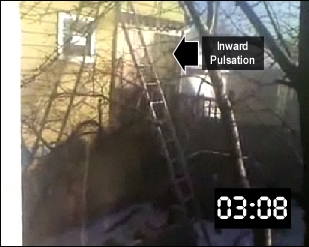
Figure 3. Conditions at 03:08 Minutes Elapsed Time in the Video Clip

0308_time

Building, Smoke, Heat and Flame indicators remain the same, but several more pulsations (03:05-03:13) providing a continuing, and more significant indication of ventilation controlled, decay stage fire conditions.

What indicators can be observed at the door while the firefighter attempts to remove the covering over the window adjacent to the door on Floor 1 (03:13-13:44)?

No significant change in Building, Heat, or Flame Indicators. However, smoke from the doorway has darkened considerably and there is a pronounced pulsation as the firefighter on the ladder climbs to Floor 2 (03:26). It is important to note that some of the smoke movement observed in the video clip is fire induced, but that exterior movement is also significantly influenced by wind.

What B-SHAF indicators do you observe at the window on Floor 2 prior to breaking the glass (03:44)?

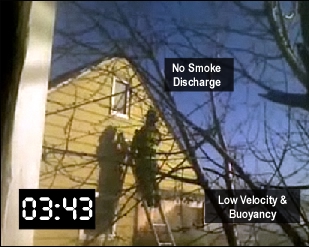
Figure 4. Conditions at 03:43 Minutes Elapsed Time in the Video Clip

0343_time

The window on Floor 2 is intact and appears to be tight as there is no smoke visible on the exterior. It is difficult to tell due to the angle from which the video was shot (and reflection from daylight), but it would be likely that the firefighter on the ladder could observe condensed pyrolizate on the window and smoke logging on Floor 2. It is interesting to note limited smoke discharge from the top of the door and window on Floor 1 in the brief period immediately prior to breaking the window on Floor 2.

What indicators are observed at the window on Floor 2 immediately after breaking the glass (03:44-03:55)?

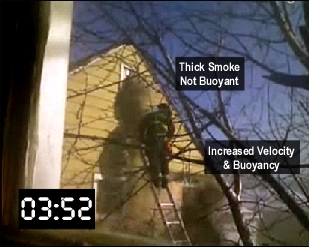
Figure 5. Conditions at 03:52 Minutes Elapsed Time in the Video Clip

0352_time

No significant changes in Building, Heat, or Flame indicators. Dark gray smoke with no buoyancy issues from the window on Floor 2 with low to moderate velocity immediately after the window is broken.

What B-SAHF indicators were present after the ventilation of the window on Floor 2 Side C was completed and 04:08 in the video clip (03:44-04:08)?

Buoyancy and velocity both increase and a slight pulsing air track develops within approximately 10 seconds. In addition, the air track at the door on Floor 1 shifts from predominantly outward with slight pulsations to predominantly inward, but with continued pulsation (possibly due to the limited size of the window opening on Floor 2, Side C.

Anticipating Potential Fire Behavior

Unlike the firefighters in Chicago who were operating at this incident, we can hit the pause button and consider the indicators observed to this point. Think about what fire behavior indicators are present (and also consider those that are not!).

Initial observations indicated a ventilation controlled decay stage fire and predicted fire behavior is an increase in heat release rate with potential for some type of extreme fire behavior. Possibilities include ventilation induced flashover (most likely) or backdraft (less likely), or smoke explosion (less likely than some type of ventilation induced extreme fire behavior).

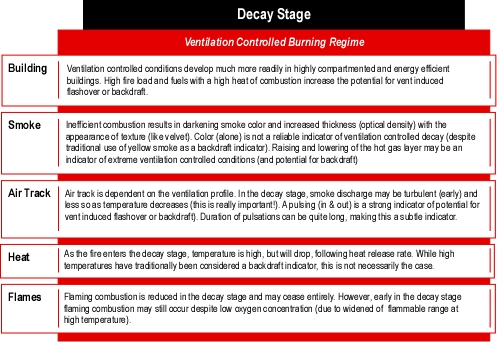
Take a minute to review the indicators of ventilation controlled, decay stage fires as illustrated in Table 1.

Table 1. Key Fire Behavior Indicators-Ventilation Controlled, Decay Stage Fires

vent_controlled_decay

Which of these indicators were present on Side C of 4855 S. Paulina Street?

Building: The building appeared to be unremarkable, a typical single family dwelling. However, most residential structures have more than enough of a fuel load to develop the conditions necessary for a variety of extreme fire behavior phenomena.

Smoke: The dark smoke with increasing thickness (optical density) is a reasonably good indicator of ventilation controlled conditions (particularly when combined with air track indicators). Lack of buoyancy indicated fairly low temperature smoke, which could be an indicator of incipient or decay stage conditions or simply distance from the origin of the fire. However, combined with smoke color, thickness, and air track indicators, this lack of buoyancy at all levels on Side C is likely an indicator of dropping temperature under decay stage conditions. This conclusion is reinforced by the increase in buoyancy after ventilation of the window on Floor 2 (increased ventilation precipitated increased heat release rate and increasing temperature).

Air Track: Pulsing air track, while at times quite subtle and masked by swirling smoke as a result of wind, is one of the strongest indications of ventilation controlled decay stage conditions. While often associated with backdraft, this indicator may also be present prior to development of a sufficient concentration of gas phase fuel (smoke) to result in a backdraft.

Heat: Velocity of smoke discharge (air track) and buoyancy (smoke) are the only two heat indicators visible in this video clip. As discussed in conjunction with smoke indicators, low velocity and initial lack of buoyancy which increases after ventilation is indicative of ventilation controlled, decay stage conditions.

Flame: Lack of visible flame is often associated with ventilation controlled decay and backdraft conditions. However, there are a number of incidents in which flames were visible prior to occurrence of a backdraft (in another compartment within the structure). Lack of flames must be considered in conjunction with the rest of the fire behavior indicators. In this incident, lack of visible flames may be related to the stage of fire development, but more likely is a result of the location of the fire, as there is no indication that flames were present on Side C prior to the start of the video clip.

What Happened?

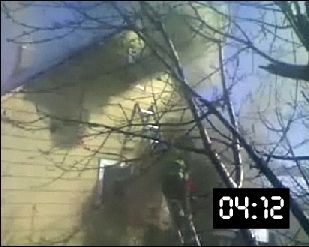
Firefighters had entered the building for fire attack while as illustrated in the video clip, others were ventilating windows on Side C. It is difficult to determine from the video if a window or door at the basement level on Side C was opened, but efforts were made to do so. A window on Floor 2 had been opened and firefighters were in the process of removing the covering (plywood) from a window immediately adjacent to the door on Floor 1. At 04:12, an explosion occurred, injuring two firefighters on the interior as well as the two firefighters engaged in ventilation operations on Side C.

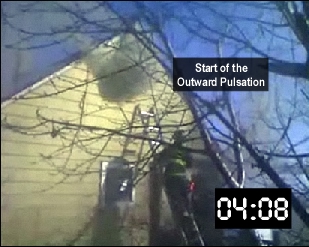
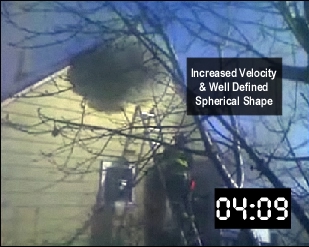
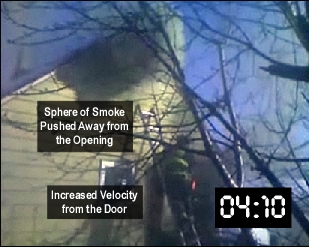
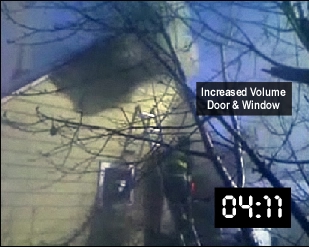
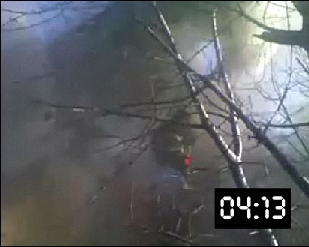
Starting at approximately 03:59, velocity of smoke discharge from the window on Floor 2 Side C increases dramatically. At 04:08 discharge of smoke begins to form a spherical pattern as discharged from the window. This pattern becomes more pronounced as the sphere of smoke is pushed away from the window by increasing velocity of smoke discharge at 04:12, immediately prior to the explosion. Velocity of smoke discharge at the door increases between 03:59 and -4:12 as well, but as the opening is larger, this change is less noticeable. As pressure increases rapidly during the explosion a whooshing sound can be heard. After the explosion, there was no noticeable increase in fire growth.

Figure 6. Conditions at 04:08 Minutes Elapsed Time in the Video Clip

0408_time

Figure 7. Conditions at 04:09 Minutes Elapsed Time in the Video Clip

0409_time

Figure 8. Conditions at 04:10 Minutes Elapsed Time in the Video Clip

0410_time

Figure 9. Conditions at 04:11 Minutes Elapsed Time in the Video Clip

0411_time

Figure 10. Conditions at 04:12 Minutes Elapsed Time in the Video Clip

0412_time

Figure 11. Conditions at 04:13 Minutes Elapsed Time in the Video Clip

0413_time

Based on observation of fire behavior indicators visible in the video clip, we know that a transient extreme fire behavior event occurred while a crew was advancing a hoseline on the interior and ventilation operations were being conducted on Side C. What we don’t know is what firefighting operations were occurring on the other sides of the building or in the interior. In addition, we do not have substantive information from the fire investigation that occurred after the fire was extinguished.

The Ontology of Extreme Fire Behavior presented in an earlier post classifies these types of phenomena on the basis of outcome and conditions. As a transient and explosive event, this was likely a backdraft or smoke explosion. In that this occurred following entry and during ongoing ventilation operations, I am inclined to suspect that it was a backdraft.

Indicators visible on Side C provided a subtle warning of potential for some type of ventilation induced extreme fire behavior, but were likely not substantially different from conditions observed at many fires where extreme fire behavior did not occur.

As the title of the wildland firefighting course S133 states; Look Up, Look Down, Look Around! Anticipation of fire development and extreme fire behavior requires not only recognition of key indicators, but that these indicators be viewed from a holistic perspective. Firefighters and/or officers performing a single task or tactical assignment may only see part of the picture. It is essential that key indicators be communicated to allow a more complete picture of what is occurring and what may occur as incident operations progress.

Ed Hartin, MS, EFO, MIFireE, CFO

Chicago-Extreme Fire Behavior

Saturday, March 6th, 2010

Updated March 7, 2010 with Longer Video Clip of this Incident

On the afternoon of February 18, 2010, firefighters in Chicago responded to a residential fire at 4855 S. Paulina Street. First arriving companies discovered a fire in the basement of a 1-1/2 story, wood frame, single family dwelling and initiated fire attack and horizontal ventilation of the floors above the fire.

Based on news accounts, the company assigned to fire attack was in the stairwell and another firefighter was performing horizontal ventilation of the floors above the fire on Side C when a backdraft or smoke explosion occurred. Three firefighters on the interior and the firefighter on the ladder on Side C were injured and were transported to local hospitals for burns and possible airway injuries.

Figure 1. Consider Key Fire Behavior Indicators

chicago_backdraft

B-SAHF Indicators

Recognizing subtle fire behavior indicators during incident operations can be difficult and important indicators are often only visible from one location (other than where you are). What Building, Smoke, Heat, and Flame (B-SAHF) indicators would you anticipate seeing if potential backdraft conditions exist (or may develop as the incident progresses)? How would this differ from the indicators that conditions may present risk of a smoke explosion?

For more information on key fire behavior indicators related to ventilation controlled burning regime, decay stage fires, backdraft, and smoke explosion, see the following posts:

Incident Video

A video of the incident at 4855 S. Paulina Street was recently posted on YouTube (a shorter version is posted on Firevideo.net). It appears that the video may have been shot through a window by an occupant of the D2 exposure. The title of this video is “Chicago Smoke Explosion”. After watching the video and answering the questions posed in this post, do you think that this was a backdraft or smoke explosion? Why?

One of the great assets of using video as a learning tool is the ability to stop the action and go back to review key information. Watch the video and stop the action as necessary to answer the following questions”

  • Pause at 02:05. What B-SAHF indicators could be observed on Side C up to this point in the video clip?
  • Pause at 02:49. What indicators could be observed while the firefighter was forcing entry and ventilating the daylight basement on Side C?
  • Pause at 03:13. What B-SAHF indicators can be observed at the door on Side C prior to forced entry?
  • Pause at 03:35. What indicators can be observed at the door after forcing the outer door (prior to ventilation of the window on Floor 2)?
  • Pause at 03:44. What B-SHAF indicators do you observe at the window on Floor 2 prior to breaking the glass?
  • Pause at 03:55. What indicators are observed at the window on Floor 2 immediately after breaking the glass?
  • Pause at 04:08. What B-SAHF indicators were present after the ventilation of the window on Floor 2 Side C was completed and 04:08 in the video clip?

After answering the questions, watch the complete clip. Do you think that this was a backdraft or smoke explosion? If you thought that this was a backdraft: Did you see potential indicators? If so what were they? If not, why do you think that this was the case? If you think that this was a smoke explosion, what indications lead you to this conclusion? What indicators were present?

You may want to watch this video clip several times and give some thought to what factors were influencing the B-SAHF indicators (particularly smoke, air track, and heat). Were these indicators consistent with your perception of backdraft indicators? Is so, how? If not, what was different? What indicators may have been visible from other vantage points. Remember that the video provides a view from a single perspective (and one that is considerably different than the crews working at this incident).

The next post in this series will take a closer look at the video and key fire behavior indicators.

Ed Hartin, MS, EFO, MIFireE, CFO