Posts Tagged ‘fire development’

Gas Cooling: Part 4

Sunday, September 12th, 2010

Reading the Fire

Before returning to discussion of the science underlying gas cooling as a fire control technique, I wanted to share a video of an industrial fire in Maidencreek Township, Pennsylvania that provides an excellent illustration of smoke and air track indicators. Watch the first minute (1:00) of the video and answer the following questions:

  • Consider how you would read the smoke and air track indicators (particularly the level of the neutral plane and velocity) if this was a single family dwelling. How is air track indicators are different in a large building (with multiple ventilation openings) such as was the case in this incident?
  • What stage of development (incipient, growth, fully developed, or decay) and burning regime (fuel or ventilation controlled) is this fire in?
  • Watch the remainder of the video and examine the effectiveness of the master stream application? Are the streams effective? Why or why not? What could be done to increase the effectiveness of application?

For additional information on reading the fire, see the following posts:

Gas Laws

Paraphrasing Albert Einstein, British science writer Simon Singh stated that, “Science has nothing to do with common sense. Common sense is a set of prejudices” (Capps, 2010, p. 115). One of the challenges faced by firefighters engaging with the science of their craft is the common sense understanding of the fire environment and firefighting practices. This post continues examination of gas cooling as a fire control technique, by peeling off a few more layers and digging deeper into the underlying science related to the behavior of gases.

Readers who have worked through Gas Cooling Part 1, Part 2, and Part 3 have a reasonable idea how a small volume of water can reduce the temperature of the upper layer in a compartment and also reduce the volume of the upper layer (raising the level of the lower boundary of the layer). In addition, readers are likely to also understand the limitations of the simple explanation provided in prior posts.

In Water and Other Extinguishing Agents (Särdqvist,2002), Dr. Stefan Särdqvist provides a fairly detailed explanation of volume changes during smoke cooling and examines how the percentage of water vaporizing in the upper layer influences these changes. Understanding Stefan’s explanation requires a good understanding of the ideal gas law and a willingness to work through the math.

Gas Laws

The introduction to the gas laws and overview of Charles’s Law was provided in Gas Cooling: Part 3. This content has been repeated in this post, to save you from going back to the previous post.

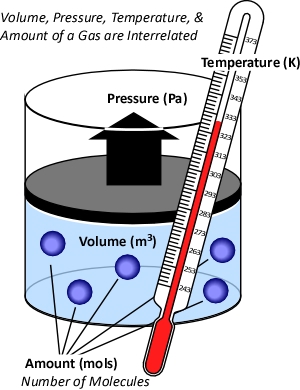
While gases have different characteristics and properties, the behavior of gases can be described in general terms using the ideal gas law. This physical law describes the relationship between absolute temperature, volume, and pressure of a given amount of an ideal gas.

Figure 1. Temperature, Volume, Pressure & Amount
The concept of an ideal gas is based on the following assumptions:

  • Gases consist of molecules in random motion
  • The volume of the molecules is negligible in comparison to the total volume occupied by the gas
  • Intermolecular forces (i.e., attractive forces between molecules) are negligible
  • Pressure is the result of gas molecules colliding with the walls of its container

The ideal gas law is actually a synthesis of several other physical laws that each describes a single characteristic of the behavior of gases in a closed system (enclosed in some type of container).

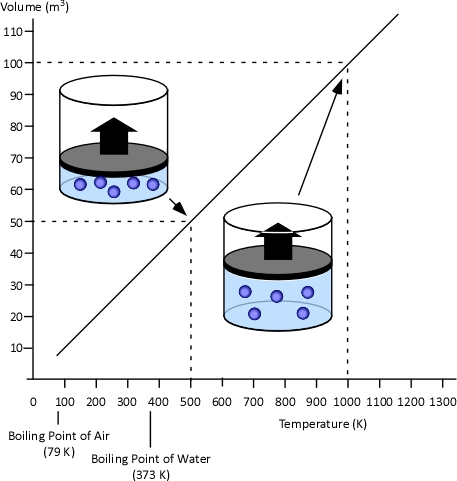
Charles’s Law: In the 1780s, French scientist Jacques Charles studied the effect of temperature on a sample of gas at a constant pressure. Charles found that as the gas was heated, the volume increased. As the gas was cooled, the volume decreased. This finding gave rise to Charles’s Law which states that at a constant pressure the volume of a given amount (mass or number of molecules) of an ideal gas increases or decreases in direct proportion with its absolute (thermodynamic) temperature. The symbol  is used to express a proportional relationship (much the same as = is used to express equality), so this relationship can be expressed as:

Where:

V=Volume

T=Temperature

When two values (such as volume and temperature in Charles’s Law) are proportional, one is a consistent multiple of the other. For example If one value was consistently eight times the other, the values would also be proportional. In the case of Charles’s Law when the absolute temperature of a gas doubles, the pressure doubles. Figure 2 illustrates the relationship between absolute temperature in Kelvins (K) and volume in cubic millimeters (mm3).

Figure 2. Charles’s Law
This relationship can also be stated using the following equation:

Where

V=Volume

T=Temperature

Subscript of 1 refers to initial conditions

Subscript of 2 refers to final conditions

Gay-Lussac’s Law: When Jacques Charles discovered the relationship between temperature and volume, he also discovered a similar relationship between temperature and pressure. However, Charles never published this discovery. Charles’s work on temperature and pressure was recreated by French chemist Joseph-Louis Gay-Lussac. Gay Lussac’s Law states that if the volume of an ideal gas is held constant, the pressure of a given amount (mass or number of molecules) of an ideal gas increases or decreases proportionally with its absolute temperature. As with Charles’s Law, Gay-Lussac’s law can be expressed mathematically as:

Where

V=Volume

P=Pressure

Figure 3. Gay-Lussac’s Law
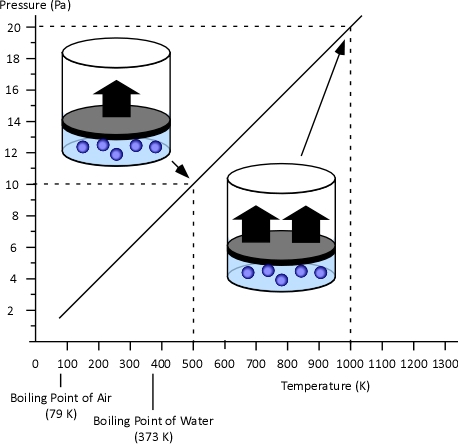
Boyle’s Law: in the 1660s, Irish physicist Robert Boyle studied the relationship of pressure and volume of gases. Boyle discovered that as pressure on a gas was increased, its volume decreased. Boyle’s Law states that if the temperature of an ideal gas is held constant, the pressure and volume of a given amount (mass or number of molecules) of an ideal gas are inversely proportional, as pressure increases, the volume occupied by the gas decreases. Boyle’s Law can be expressed mathematically as:

Where:

V=Volume

P=Pressure

Figure 4. Boyle’s Law
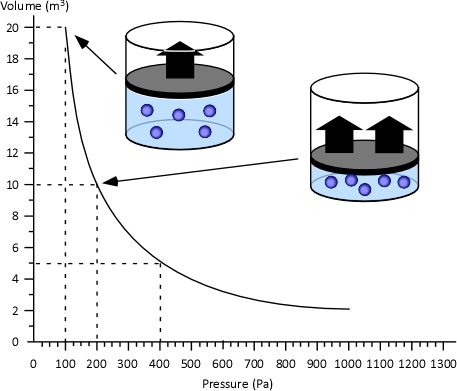
General Gas Law: The General Gas Law simply integrates Charles’s, Gay-Lussac’s, and Boyle’s Laws to state that the volume of an ideal gas is proportional to the amount (number of molecules) and absolute temperature and inversely proportional to pressure. The General Gas Law can be expressed mathematically as:

Where:

V=Volume

n=Mole (mol)

T=Temperature

P=Pressure

The General Gas Law defines the amount of gas in terms of the number of molecules, measured in moles (which has nothing to do with the animal having the same name).

Mole: While related to Avogadro’s Law, the term mole as a unit of measure was conceived by German chemist Wilhelm Ostwald in 1893. Unlike liters or grams, a mole is not a unit of volume or mass, but a counting unit. A mole is defined as the quantity of anything that has the same number of particles found in 12 grams of carbon-12. As atoms and molecules are extremely small, a mole is a large number of molecules. Specifically a mole contains 602,510,000,000,000,000,000,000 (more commonly written 6.0251 x 10²³ in scientific notation) molecules of a substance. The number of moles of a substance is denoted by the letter n. In SI units, a kilogram mole (Kmol) is often used instead of the mole. A Kmol is 1000 mol or 6.0251 x 1026 molecules of a substance.

It may seem that using the mole to measure an amount of a substance makes this more complicated. After all, why not use a measure of volume such as liters or cubic meters or mass such as grams or kilograms? Chemical formula (such as H2O for water) describes the makeup of a chemical compound in terms of the numbers of atoms of each element comprising a single molecule of the substance.

While not a unit of mass, moles can be related to mass (just as you can determine the mass of a dozen eggs of a given size, by multiplying the mass of one of the eggs by 12).

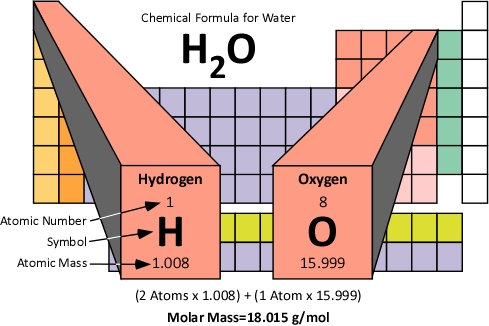
Molar Mass: The molar mass of a compound is the mass of 1.0 moles of the substance in grams. Molar mass is determined by the sum of the standard atomic weights of the atoms which form the compound multiplied by the molar mass constant (Mu) of 1 g/mol. Figure 5 illustrates how the molar mass of water is calculated.

Figure 5. Molar Mass of Water
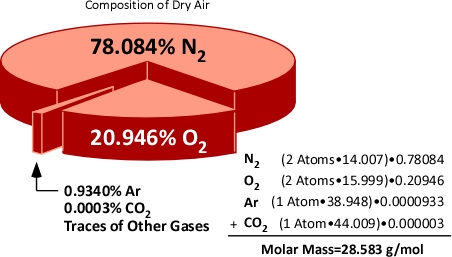
Molar mass can also be calculated for mixtures of substances. When dealing with mixtures, the molar mass of each constituent is calculated and applied proportionately on the basis of the percentage of that substance in the mixture. For example air is comprised of 78% Nitrogen, 21% Oxygen, and 1% of other gases such as Argon (Ar) and Carbon Dioxide (CO2). Nitrogen (N2) and Oxygen (O2) molecules are each comprised of two atoms (and are referred to as diatomic molecules). This means that the molar mass of Nitrogen and Oxygen molecules is twice the atomic mass.

Figure 6. Molar Mass of Air
Hopefully how the concepts of the mole and molar mass can be applied will become clear after examining the expansion of water when turned to steam and application of the gas laws to integrate steam expansion and changes in volume of the upper layer during gas cooling under a variety of circumstances.

Avogadro’s Law: In 1811, Italian physicist and mathematician Amedeo Avogadro published a theory regarding the relationship of the number of molecules in a gas if temperature, pressure, and volume are held constant. Avogadro’s Law states that samples of ideal gasses, at the same absolute temperature, pressure and volume, contain the same number of molecules regardless of their chemical nature and physical properties. More specifically, at a temperature of 273 K (0oC) and absolute pressure of 101300 Pa, 22.41 L (0.001 m3) of an ideal gas contains 6.0251 x 10²³ molecules (1.0 mol)

Ideal Gas Law: This gas law integrates Avogadro’s law with the Combined Gas Law. If the number of molecules in a specific volume of an ideal gas at a consistent temperature and pressure (273 K and 101300 Pa) is always the same, then the proportional relationship between pressure, volume, temperature, and amount can be defined as having a constant value (Universal Gas Constant).

Where:

P=Pressure (Pa)

V= Volume (m3)

T=Temperature (K)

n=Moles

Ru=Universal Gas Constant (8.3145 J/mol K)

Universal Gas Constant (Ru): This physical constant identifies the internal kinetic energy per mole of an ideal gas for each Kelvin of temperature (J/mol K). As it is universal this constant is the same for all gases that demonstrate the properties of an ideal gas.

If the pressure, volume, and temperature of an ideal gas can be observed and Avogadro’s Law is accepted as being true (making the amount of gas also known), the value of the Universal Gas Constant can be determined empirically (based on observation) by solving the ideal gas law equation for Ru.

Where:

V=Volume

Ru=Universal Gas Constant

n=Moles

T=Temperature

P=Pressure

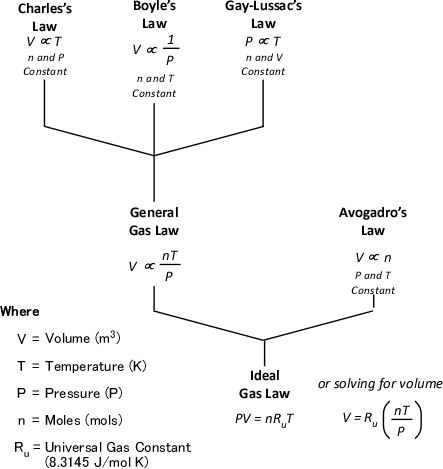
Figure 7 illustrates each of the gas laws and how they are integrated into the Ideal Gas Law.

Figure 7. Gas Laws
Application-Steam Expansion

As stated in Gas Cooling: Part 3, the 5th Edition of the Essentials of Firefighting (IFSTA, 2008) states that the volume of water expands 1700 times when it is converted to steam at 100o C (212o F). However, this information is presented as a fact to be memorized and no explanation is provided as to why this is the case or that if temperature is increased further, that the volume of steam will continue to expand. In the previous post, I asked the reader to accept this assumption with assurance that an explanation would follow. Application of the ideal gas law to expansion of steam provides an excellent opportunity to exercise your understanding of the gas laws and other scientific concepts presented in this post.

What we know:

  • Molecular Mass of Water: 18 g/mol
  • Boiling Point of Water at Atmospheric Pressure: 100o C (373.15 K)
  • Density of Water at 20o C (293.15 K): 1000000 g/m3
  • Atmospheric Pressure: 101325 Pa
  • Ideal Gas Constant (Ru): 8.3145 J/mol K

What we need to find out:

  1. What is the volume of 1 mole of steam
  2. What is the density (mass per unit volume) of steam at 100o C
  3. What is the ratio between the density of water and the density of steam at 100o C

The volume of 1 mole of pure steam can be calculated by solving the ideal gas equation for V.
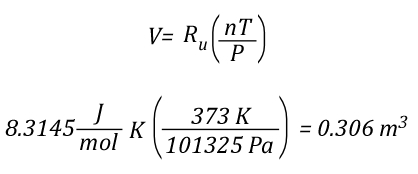
As 1 mole of water (in the liquid or gaseous phase) contains the same number of molecules, it’s molar mass will be the same. 1 mole of water has a mass of 18 grams. Density is calculated by dividing mass by volume, so the density of steam at 100o C can be calculated as follows:

Dividing the density of water by the density of steam at 100o C determines the expansion ratio when a specific mass of water is vaporized into steam at this temperature.

This means that if a specific mass of water is vaporized into steam at 100o C, its volume will expand 1700 times. So the 5th Edition of the Essentials of Firefighting (IFSTA, 2008) is correct, but now you know why. However, what would happen if the steam continued to absorb energy from the upper layer and its temperature increased from 100o C to 300o C, the mass of the steam would remain the same, but what would happen to the volume? You can use the Ideal Gas Law to solve this question as well.

The Next Step

Just as the Ideal Gas Law can be used to determine the expiation ratio of steam, it can also be used to calculate contraction of the upper layer as it is cooled. The next post will examine how Dr. Stefan Särdqvist integrates these two calculations to determine changes in the volume of the upper layer under a variety of conditions.

New Book

Greg Gorbett and Jim Phar of Eastern Kentucky University (EKU) have written a textbook titled Fire Dynamics focused on meeting the Fire and Emergency Services Higher Education (FESHE) curriculum requirements for Fire Behavior and Combustion. I just received my copy and at first glance it appears to be an excellent work (as I would expect from these outstanding fire service educators). One useful feature of the text is a basic review of math, chemistry, and physics as it relates to the content of the course. I will be dong a more detailed review of the book in a subsequent post, but wanted to give readers of the CFBT-US Blog a heads up that it had been released.

Ed Hartin, MS, EFO, MIFireE, CFO

References

International Fire Service Training Association (IFSTA). (2008). Essentials of firefighting (5th ed). Stillwater, OK: Fire Protection Publications.

Särdqvist, S. (2002) Water and other extinguishing agents. Karlstad, Sweden: Räddnings Verket

Battle Drill Part 2

Thursday, February 11th, 2010

A Quick Review

As discussed in the last post in this series, military battle drills are an immediate response to enemy contact that requires fire and maneuver in order to succeed. Battle drills are initiated with minimal commands from the unit leader. Soldiers or marines execute preplanned, sequential actions in response to enemy contact.

This post discusses application of the battle drill concept in training firefighters to react appropriately on contact with our enemy (the fire) which requires fire (application of water) and maneuver (movement to a safer location) in order to succeed.

Remember: The key elements of a battle drill are fire and maneuver! This requires the ability to operate and maintain control of the hoseline while moving backward.

Working Without a Hoseline

In the United States, it is common for some companies working on the fireground to operate inside burning buildings without a hoseline (particularly when performing search). While common, this practice places firefighters at considerable risk when faced with extreme fire behavior. Without a hoseline your only defense against rapid fire progress is recognition of developing conditions and immediate reaction to escape to a safer location (see video below); which is not always possible. In some cases, firefighters fail to recognize developing conditions or the speed with which conditions will change. In other cases, firefighters are unable to escape or take refuge outside the flow path of hot gases and flames quickly enough.

Cl

If your department’s operational doctrine includes companies working on the interior without a hoseline (or without being directly supported by a hoseline), it is essential that firefighters are trained to 1) recognize early indicators of potential for extreme fire behavior and 2) maintain a high level of awareness regarding locations which may provide an area of refuge. When confronted by rapidly worsening conditions, action to escape must be immediate and without hesitation.

Extreme Fire Behavior Battle Drill

Regardless of their assignment (e.g., fire attack, primary search), firefighters with a hoseline have a solid means of maintaining orientation, a defined primary escape route, and the ability to actively control the fire environment through application of water. However, as always, safe and effective operation in the fire environment is dependent on a solid size-up, dynamic risk assessment, maintenance of a high level of situational awareness, and proactively controlling the fire environment. The best way to deal with extreme fire behavior is to avoid it or prevent it from occurring. For more information on reading the fire and key fire behavior indicators related to potential for extreme fire behavior, see:

In situations where you were unable to recognize potential for extreme fire behavior or you have been unable to control the fire environment, immediate action is required!

This is my nozzle, there are many like it but this one is mine. My nozzle is my best friend. It is my life. I must master it as I master my life. Without me it is useless, without my nozzle I am useless.

I will use my nozzle effectively and efficiently to put water where it is needed. I will learn its weaknesses, its strengths, its parts, and its care. I will guard it against damage, keep it clean and ready. This I swear.

As stated in the first paragraph of this adaptation of the United States Marine Corps Riflemans’ Creed, Without my nozzle I am useless.

The extent of thermal insult experienced in an extreme fire behavior event is dependent on both radiant and convective heat flux. Total radiant heat flux is dependent on temperature (of gases and compartment linings) and flow of hot gases. The higher the temperature and faster the speed of gas flow, the higher the heat flux. These scientific concepts drive the key elements of the extreme fire behavior battle drill. Extinguish or block the flames, cool hot gases, and maneuver out of the flow path to a point of egress or area of safer refuge.

Drill 8-Extreme Fire Behavior Battle Drill: Key hose handling and nozzle techniques when faced with extreme fire behavior are the ability to apply long pulses of water fog or maintaining a continuous flow rate while maneuvering backwards. This requires a coordinated effort on the part of the nozzle operator, backup firefighter, and potentially other firefighters working on the hoseline or at the point of entry.

Hose Handling & Nozzle Technique Drill 8 Instructional Plan

While this drill focuses on single company operations, it is important to extend this training to include crews operating backup lines. The importance, function, and operation of the backup line will be the focus of the next post in this series.

Not all That is Learned is Taught

When training to operate in a hazardous environment, avoid the mindset that it’s only a drill. As often observed, you will play the way that you practice. Extreme stress can activate inappropriate routine responses. For example, a Swedish army officer suddenly stood up while his unit was under fire while engaged in peacekeeping efforts in Bosnia. When asked about this response, he explained that in training, he often stood up while leading exercises (Wallenius, Johansson, & Larsson, 2002).

“A simple set of skills , combined with an emphasis on actions requiring complex and gross motor muscle operations (as opposed to fine motor control), all extensively rehearsed, allows for extraordinary performance levels under stress” (Grossman, 2008, p. 38).

When developing skill in nozzle technique and hose handline, and in particular the critical skills required to effectively perform this extreme fire behavior battle drill, it is essential to maintain critical elements of context such as appropriate use of personal protective equipment, position, and technique.

Ed Hartin, MS, EFO, MIFireE, CFO

References

Grossman, D. (2008). On-combat: The psychology and physiology of deadly conflict in war and peace. Millstadt, IL: Warrior Science Publications.

Wallenius, C. Johansson, C. & Larsson, G. (2002). Reactions and performance of Swedish peacekeepers in life-threatening situations. International Peacekeeping, 9(1), 133-152.

2010 Congreso Internacional Fuego y Rescate

Saturday, January 30th, 2010

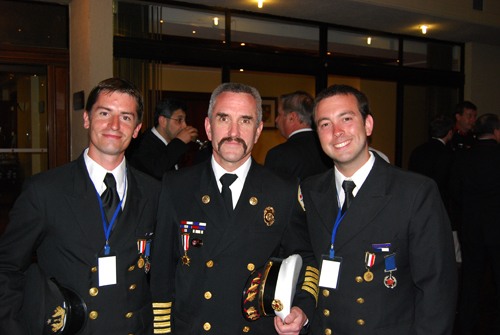
At a formal dinner on 23 January 2010, Chief Ed Hartin was recognized as an honorary member of Company 1 Germania of the Valdivia, Chile Fire Department. In addition, he was awarded a commendation for supporting the ongoing professional development of the members of Company 1 Germania of the Valdivia, Chile Fire Department and encouraging them in their efforts to share their knowledge with Chiles fire service.

Commendation for Support of Company 1 Germania

commendation

Left to Right: Teniente Juan Esteban Kunstmann, Chief Ed Hartin, Capitn Francisco Silva V.

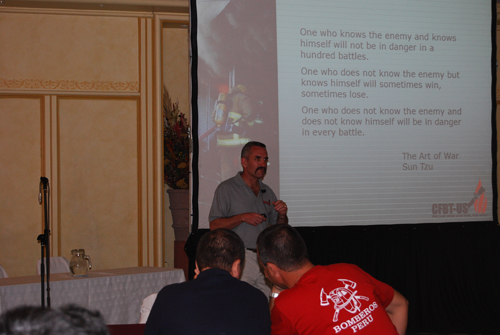
On 24-27 January 2007, the Company 1 Germania of the Valdivia, Chile Fire Department hosted the first international fire service congress to be held in South America. Participants included over 150 firefighters and officers from Chile, Peru, Argentina, and the United States. The congress provided an opportunity to participate in both classroom and hands-on workshops on a wide range of fire service topics including fire behavior, ventilation, search, rapid intervention, technical rescue, and extrication. While topical areas were diverse, the congress had a substantive emphasis on compartment fire behavior with lectures presented by CFBT-US Chief Instructor Ed Hartin and Geraldo Crespo of Contraincendio in Buenos Aires, Argentina and practical training sessions conducted by Ed Hartin and Juan Esteban Kunstmann of the Valdivia Company 1 Germania.

Lecture Presentation

ed_cl_classroom

Lecture presentations by CFBT-US Chief Instructor Ed Hartin included (click on the links for a copies of the presentations):

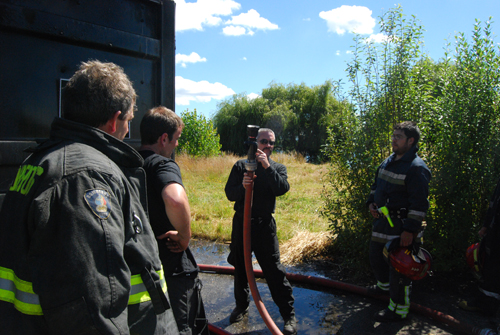
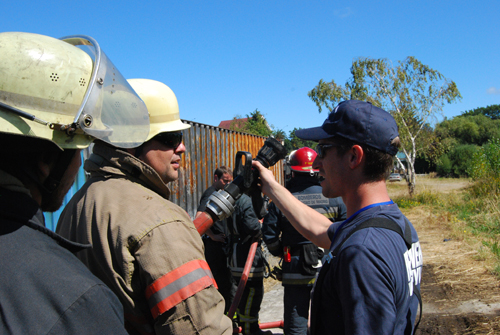
CFBT practical skills sessions were held at the Valdivia Fire Departments training center and focused on developing basic skill in nozzle technique and understanding fire development in a compartment.

This is My Nozzle! There are many like it, but this one is mine

ed_cl_practical

Center: Ed Hartin

Practicing Nozzle Techniques

juan_cl_practical

Right: Teniente Juan Esteban Kunstmann

International Collaboration

giancarlo_cl_practical

Left to Right: Battalion Chief Danny Sheridan, FDNY and Capitn Giancarlo Passalacqua Cognoro, Lima, Pe?u Cuerpo General de Bomberos Voluntarios

Congratulations to the members of Company 1 Germania for their success with the first Congreso Internacional Fuego y Rescate! I look forward to working with these outstanding fire service professionals in their ongoing efforts to learn and share knowledge with the fire service throughout Chile, Latin America, and the World.

Ed Hartin, MS, EFO, MIFireE, CFO

Recent Extreme Fire Behavior

Tuesday, January 19th, 2010

Two recent events in Baltimore, Maryland and Gary, Indiana point to the criticality of recognizing key fire behavior indicators and understanding practical fire dynamics.

Five Firefighters Injured in Baltimore

Early on the morning of Friday, January 15, 2010, the Baltimore City Fire Department was dispatched to a residential fire Southeast Baltimore. First arriving companies observed a row house of ordinary construction with a large volume of smoke and flames issuing from the basement and extending to the first floor.

According to a department spokesperson, the first engine took a line through the front door to the rear kitchen area where crew had some trouble finding the basement stairs. Another engine company went to the rear with a line to the outside stairwell leading to the basement and was just starting down the stairs. The first truck vented some skylights on the roof as well as the front basement windows. As crews were attempting to access the fire, some type of transient extreme fire behavior resulted in flames blowing through the unit and out the front door, rear stairwell, second floor windows, and skylights. The firefighter from the first arriving truck assigned to the roof described the sound of a freight train coming through.

Five firefighters injured as a result of this explosive fire behavior phenomenon were transported to area hospitals. The officer of the first in engine company was admitted to the Bayview Burn Center, where he is listed in stable condition


Find more videos like this on firevideo.net

What Happened?

As always when a video of an incident involving extreme fire behavior is posted to the web, there is ongoing debate about what happened. Was it a backdraft? Was it a flashover? An interesting debate, but the value is not so much in being right, but in understanding how these phenomena occur, what might have happened in this incident, key indicators that may (or may not) be visible in the video, and most importantly how to prevent this from happening to us and the firefighters that we work with!

Flashover: sudden transition to fully developed fire. This phenomenon involves a rapid transition to a state of total surface involvement of all combustible material within the compartment.

Given adequate fuel and ventilation, a compartment fire may reach flashover as it develops from the growth to fully developed stage. However, when fire development is limited by the ventilation profile of the compartment, changes in ventilation will directly influence fire behavior.

For many years firefighters have been taught that ventilation reduces the potential for flashover. However, when a fire is ventilation controlled, heat release rate is limited by the available oxygen. Under these conditions; increasing air supply by creating opening results in increased heat release rate. This increased heat release rate may result in flashover.

If a fire is sufficiently ventilation controlled and a high concentration of excess pyrolizate and unburned flammable products of combustion accumulate in a compartment, the outcome of increased ventilation may be different.

Backdraft: Deflagration of unburned pyrolyzate and combustion products following introduction of air to a ventilation controlled compartment fire and ignition of the fuel/air mixture. This deflagration results in a rapid increase in pressure within the compartment and extension of flaming combustion through compartment openings. Occurrence of this phenomenon requires an atmosphere in which the fuel concentration is too high to deflagrate without introduction of additional oxygen.

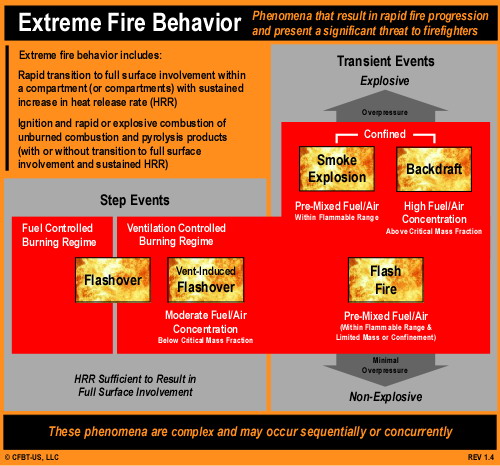
As introduced in Extreme Fire Behavior: An Organizational Scheme, extreme fire behavior phenomena can be classified on the basis of outcome and conditions (see Figure 1)

Figure 1. Extreme Fire Behavior Classification.

extreme_fire_behavior_sr

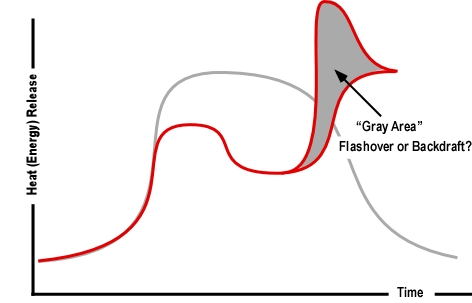
Use of this approach may aid in making sense of what may have occurred in the Baltimore incident. But, it is often difficult to classify extreme fire behavior phenomena into discrete, black and white categories. What is the dividing line between a ventilation induced flashover and a backdraft. One key difference may be the speed with which heat release rate increases, but where is the dividing line (see Figure 2)?

Figure 2. The Gray Area.

gray_area

Keep in mind that while being right is great, it is more important to work through the process of figuring things out to improve your understanding.

Near Miss in Gary

Monday morning January 18, 2010 firefighters in Gary, Indiana were operating at a residential fire at 24th and Massachusetts when they experienced a near miss involving rapid fire progression. Have a look at video of this incident and give some thought to what influenced fire behavior. Also look at the similarities and differences between the extreme fire behavior that occurred in the Baltimore and Gary incidents.

Master Your Craft

Back on Task!

I have been extremely busy working on a project for the National Institute for Occupational Safety and Health and preparing for the International Fire & Rescue Congress in Valdivia, Chile. Next weeks post will provide a quick update on training conducted at the Congress.

After returning from Chile, I will be back on task with examination of the concept of battle drills to develop effective reaction to worsening fire conditions while operating in an offensive mode.

Ed Hartin, MS, EFO, MIFireE, CFO

Reading the Fire 13

Thursday, January 7th, 2010

As we start the New Year it is a good time to reaffirm our commitment to mastering our craft. Developing and maintaining proficiency in reading the Fire using the B-SAHF (Building, Smoke, Air Track, Heat, and Flame) organizing scheme for fire behavior indicators, requires practice. This post provides an opportunity to exercise your skills using a video segment shot during a residential fire.

Residential Fire

Early on the morning of December 23, 2009, the Cheektowaga Police department was dispatched to 305 Highland Drive in Cheektowaga to investigate a 911 call for an unknown type problem. The female caller was screaming, but the dispatcher was unable to determine the nature of the emergency. The first arriving police unit discovered a residential fire with persons trapped, and requested fire response. The police officers rescued a male victim from just inside the door, but fire and smoke conditions prevented them from assisting the other occupants.

The Hy-View Volunteer Fire Company responded with a first alarm assignment and observed flames showing on Side C.

Download and the B-SAHF Worksheet.

Watch the first 1 minute 10 seconds (1:10) of the video. This segment was shot from Side B at the B/C Corner. First, describe what you observe in terms of the Building, Smoke, Air Track, Heat, and Flame Indicators; then answer the following five standard questions?

  1. What additional information would you like to have? How could you obtain it?
  2. What stage(s) of development is the fire likely to be in (incipient, growth, fully developed, or decay)?
  3. What burning regime is the fire in (fuel controlled or ventilation controlled)?
  4. What conditions would you expect to find inside this building? If presented with persons reported (as the first arriving companies were) how would you assess potential for victim survival?
  5. How would you expect the fire to develop over the next two to three minutes

Now watch the remainder of the video clip and answer the following questions:

  1. Did fire conditions progress as you anticipated?
  2. A voice heard in the video states that this was a backdraft. Do you agree? Why or why not?

Hy-View Volunteer Fire Company personnel recovered two female civilian victims from the residents. However, all three victims died as a result of smoke inhalation.

Master Your Craft

Ed Hartin, MS, EFO, MIFIreE, CFO

Did You Ever Wonder?

Thursday, December 24th, 2009

The ability to read the fire and predict likely fire behavior is a critical skill for both firefighters and fire officers. Previous posts have examined how to use the B-SAHF scheme to recognize critical fire behavior indicators and identify the stage of fire development, burning regime, and potential for extreme fire behavior such as flashover or backdraft. However, there is something missing!

Experience is critical to adapting standard procedures and practices to a complex and dynamic operational environment. However, learning about fire behavior and changes in fire conditions based on fireground observations are a bit like a black box test. Black box testing is a technique for testing computer software in which the internal workings of the item being tested are not known by the tester. This is not entirely true in the case of fire behavior, but there is much that we dont know when assessing conditions on the fireground. How long has the fire been burning? What are the specific characteristics of the fuel? What sort of internal compartmentation is present? What exactly is the ventilation profile? Some of these factors can be determined during fire investigation and it is also possible to determine (with some degree of uncertainty) what influence these factors had on the outcome of the incident. Did you ever wonder how fire behavior would have changed if you had used different tactics? Unfortunately, in real life there are no do overs!

UL Tactical Ventilation Research Project

One of the people who has asked himself the question of what would have changed if different tactics were used is Underwriters Laboratories Fire Protection Engineer Steve Kerber.

Underwriters Laboratories (UL) has received a Firefighter Safety Research and Development Grant from the Department of Homeland Security (DHS). This research project will investigate and analyze the impact of natural horizontal ventilation on fire development and conditions in legacy (older, more highly compartmented) and contemporary (multi-level, open floor plan) residential structures.

Preliminary work has included review of literature related to horizontal ventilation and incidents in which ventilation had a significant influence on firefighter injuries and fatalities. In addition, UL has done preliminary work on the performance of various structural components such as single and multi-pane windows as preliminary input for design of full scale residential fire experiments.

In mid-December 2009, Steve Kerber met with the project advisory panel comprised of Captain Charles Bailey, Montgomery County (MD) Fire Department; Lieutenant John Ceriello New York City Fire Department, Firefighter James Dalton and Director of Training Richard Edgeworth, Chicago Fire Department, Chief Ed Hartin, Central Whidbey Island (WA) Fire & Rescue, Chief Otto Huber Loveland-Symmes (OH) Fire Department, and Chief Mark Nolan, Northbrook (IL) Fire Department. In addition, the advisory panel includes Fire Protection Engineers Dan Madrzykowski from the National Institute of Standards and Technology (NIST) and Dr. Stefan Svensson, a research and development engineer from the Swedish Civil Contingencies Agency.

Figure 1. Defining Experiment Parameters for the Contemporary Structure

kerber_plans

The main task presented to the advisory panel at the first meeting was to aid in defining the parameters for the experiment; including fire location, changes in ventilation profile, timing of these changes, and instrumentation to measure effects on fire development and conditions.

UL Large Fire Research Facility

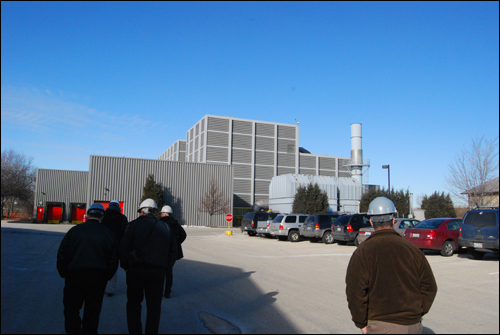
The ventilation experiments will be conducted at the UL Large Fire Research Facility in Northbrook, IL. From the exterior, this facility simply looks like a large industrial building (see Figure 2). However, the interior of the structure includes a unique facility for fire research.

Figure 2. UL Large Fire Research Facility

ul_large_fire_lab_outside

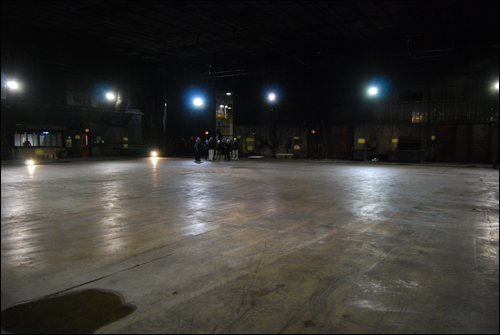
One of the facilities inside this building is a 100 x 120 (30.48 m x 36.58 m) with a ceiling height that is adjustable up to 50 (15.24 m) (see Figure 3). All of the smoke resulting from tests in this facility is exhausted through a system designed to oxidize unburned fuel and scrub hazardous products from the effluent prior to discharge to the atmosphere. Tests are monitored from a control room that overlooks the large burn room.

Figure 3. Large Burn Room

ul_large_fire_lab_inside

Over the next month, the two residential structures to be used for the ventilation experiments will be constructed inside the large burn room at the UL Large Fire Test Facility. After construction is complete, a series of 16 full scale fire experiments is planned to evaluate a range of different horizontal ventilation scenarios.

Research with the Fire Service

Steve Kerber has often stated that it is essential that scientists and engineers conduct research with, not for, the fire service. Engagement between researchers and firefighters on the street is essential in advancement of our profession. With this ventilation research project, Underwriters Laboratories is actively engaged in this process.

The outcome of this project will not simply be an academic paper (but there might be one or more of those as well). As part of the DHS grant, UL will be developing an on-line course to present the results of the experiments and their practical application on the fireground.

Happy Holidays,

Ed Hartin, MS, EFO, MIFireE, CFO

Reading the Fire 10

Thursday, October 8th, 2009

Chicago Dollar Store Fire

On the morning of October 1, 2009 the Chicago Fire Department (CFD) responded to a fire in the Super Dollar and Up store at 3952 West Cermak Road. CFD Senior Fire Alarm Operator and Fire Photographer Steve Redick captured early incident operations on video.

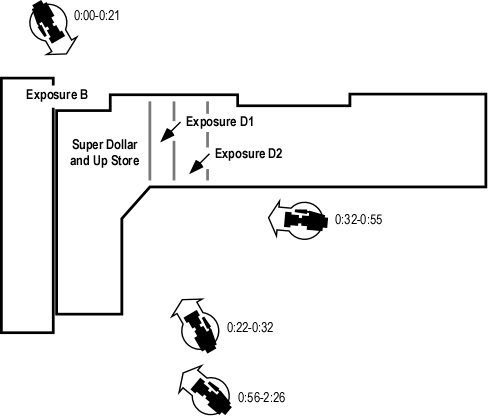
The first segment of the video was shot in the alley on Side C from the B/C Corner. The next several minutes of video are shot from positions on Side A as indicated in Figure 1.

Figure 1. Plot Plan and Approximate Video Camera Locations

chicago_plot

Download the B-SAHF Worksheet.

Watch the first 60 seconds of Video Segment 1. Consider the information provided in this segment of the video clip. First, describe what you observe in terms of the Building, Smoke, Air Track, Heat, and Flame Indicators and then answer the following five standard questions?

  1. What additional information would you like to have? How could you obtain it?
  2. What stage(s) of development is the fire likely to be in (incipient, growth, fully developed, or decay)?
  3. What burning regime is the fire in (fuel controlled or ventilation controlled)?
  4. What conditions would you expect to find inside this building?
  5. How would you expect the fire to develop over the next two to three minutes?

After completing the B-SAHF worksheet and answering the five standard questions, watch the next minute and twenty seconds of the video.

  1. Did you anticipate this change?
  2. What factors may have influenced this change in conditions?

Visit Steve Redick’s Web Site for additional video and excellent photos of this incident.

Memphis Dollar Store LODD

The rapidly changing conditions in the Chicago incident reminded me of the fire in Memphis, Tennessee that took the lives of Lieutenant Trent Kirk and Private Charles Zachary. Similar to the fire in Chicago, this incident involved a fire in a one-story, non-combustible building containing multiple commercial occupancies. As companies arrived they observed a small volume of smoke from the roof and little smoke inside the building. Approximately nine minutes after arrival conditions worsened with a large volume of smoke pushing from the doorway on Side A. Crews became disoriented as a result of rapid fire progression, and Lieutenant Kirk and Private Zachary were trapped.

For additional information on this incident see NIOSH Death in the Line of Duty Report F2003-18 and Memphis Fire Department Director’s Review Board Family Dollar Store Fire report.

Dollar Stores as a Target Hazard

Dollar stores and similar types of commercial occupancies should be considered as a target hazard that presents a significant threat to firefighters. These types of stores are generally in an enclosed building (good access from the front, but not generally from the other sides of the building) with high ceilings and a cockloft or other ceiling void space. In addition, this type of store contains a large fuel load comprised predominantly of synthetic fuel with a high heat of combustion (think high energy) and potential for extremely rapid fire development.

Fires in this type of occupancy are not uncommon! A quick search uncovered 15 similar incidents across the United States in the last three years (and 11 in 2009). There were likely more (as the scope of this search looked for fires in “dollar stores” and stopped after the first several hundred hits with the Google search engine).

  • Broadview, IL (June 9, 2009)
  • Flint, MI (August 24, 2009)
  • Lubbock, TX (September 15, 2009)
  • Terre Haute, IN (June 29, 2009)
  • New York, NY (June 9, 2009)
  • Midlothian, IL (February 6, 2008)
  • Highland Park, MI (October 7, 2007)
  • Denver, CO (June 29, 2009)
  • Sanford, FL (March 23, 2009)
  • Chattanooga, TN (April 14, 2009)
  • Conklin, NY (August 27, 2009)
  • Muncie, IN (September 16, 2009)
  • Lake Worth, TX (November 25, 2006)
  • Omaha, NE (April 8, 2008)
  • Bells Corner, PA (June 3, 2009)

Building Factors and Fire Behavior

Building factors include the construction, configuration, and contents of a structure. These factors are critical fire behavior indicators that must be assessed during pre-planning and in the course of size-up and incident operations. Consider how building size (particularly volume, ceiling height, and presence of ceiling, attic, or cockloft void spaces) impacts on both fire behavior and how the other B-SAHF indicators present.

Reporting on the Dollar Store fire in Chattanooga, TN in April 2009, a Chattanooga Fire Department spokesperson said:

At first, it appeared that the firefighters would be able to get the fire under control fairly quickly, but the fire got into the attic and was difficult to locate in the thick, black smoke… The firefighters made an interior attack and tried to use thermal imaging cameras to locate the fire. However, other firefighters noticed that the roof was beginning to sag, so the order was given to evacuate the building for the safety of the firefighters.

It is essential to recognize potential for worsening conditions and extreme fire behavior. This is particularly important when faced with an incident outside the norm of fires in residential structures such as one and two-family dwellings and apartments.

Master Your Craft

Posts from Sand, Sweden

Next week I will be posting from Sand, Sweden as 12-16 October I will be participating in a Compartment Fire Behavior Training Workshop at the Swedish Civil Contingencies Agency College. Along with representitives from Australia, Canada, Germany, and Spain, I will be studying contemporary approaches to fire behavior training as well as the evolution of Swedish fire behavior training since the 1980s. This workshop provides a tremendous opportunity to learn along with Mats Rosander, Nils Bergstrm, and Marcos Dominguez, poneers in the evolution of fire behavior training in Sweden and around the world.

Ed Hartin, MS, EFO, MIFIreE, CFO

Townhouse Fire: Washington, DC
Computer Modeling-Part 2

Monday, October 5th, 2009

This post continues study of an incident in a townhouse style apartment building in Washington, DC with examination of the extreme fire behavior that took the lives of Firefighters Anthony Phillips and Louis Mathews. As discussed in Townhouse Fire: Washington, DC-Computer Modeling Part I, this was one of the first cases where the NIST Fire Dynamics Simulator (FDS) software was used in forensic fire scene reconstruction (Madrzykowski and Vettori, 2000).

Quick Review

As discussed in prior posts, crews working on Floor 1 to locate the fire and secure the door to the stairwell were trapped and burned as a result of rapid progression of a fire in the basement up the open interior stairway after an exterior sliding glass door was opened to provide access to the basement. For detailed examination of incident operations and fire behavior, see:

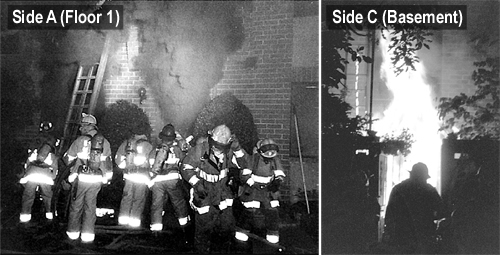
Figure 1. Conditions at Approximately 00:28

cherry_rd_sidebyside

Note: From Report from the Reconstruction Committee: Fire at 3146 Cherry Road NE, Washington DC, May 30, 1999, p. 29 & 32. District of Columbia Fire & EMS, 2000.

Smokeview

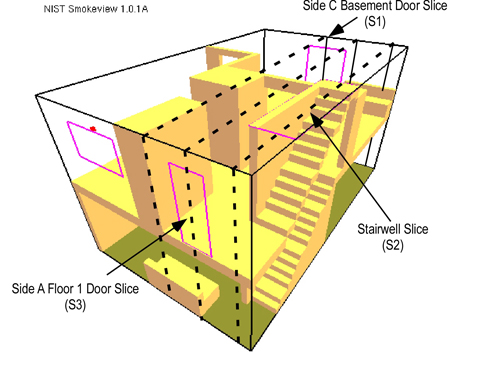
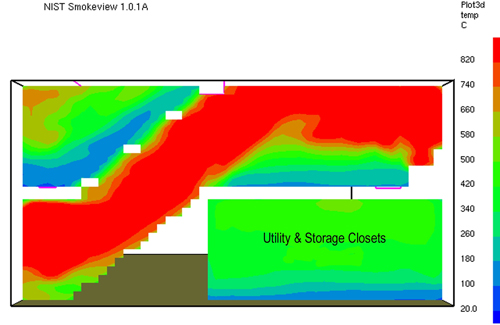
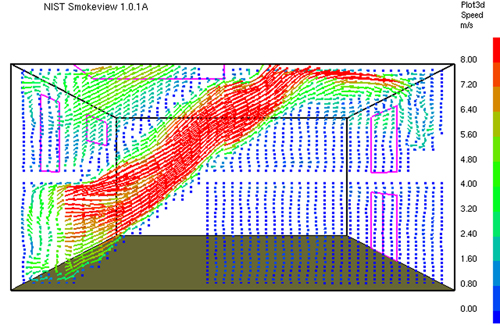
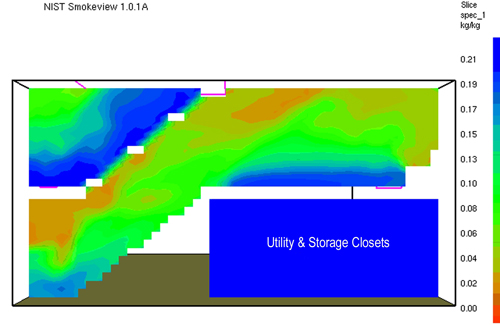
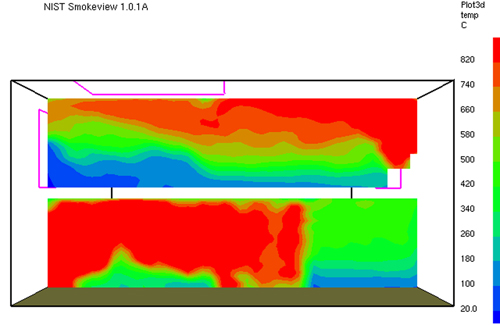
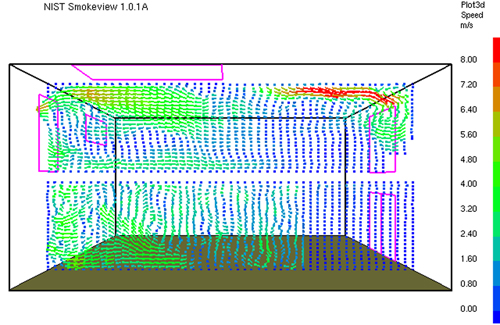
Smokeview is a visualization program used to provide a graphical display of a FDS model simulation in the form of an animation or snapshot. Snapshots illustrate conditions in a specific plane or slice within the building. Three vertical slices are important to understanding the fire dynamics involved in the Cherry Road incident: 1) midline of the door on Floor 1, Side A, 2) midline of the Basement Door, Side C, and midline of the Basement Stairwell (see Figure 2). Imagine that the building is cut open along the slice and that you can observe the temperature, oxygen concentration, or velocity of gas movement within that plane.

Figure 2. Perspective View of 3146 Cherry Road and Location of Slices

slices_sr

Note: From Simulation of the Dynamics of the Fire at 3146 Cherry Road NE Washington D.C., May 30, 1999, NISTR 6510 (p. 15) by Dan Madrzykowski and Robert Vettori, 2000, Gaithersburg, MD: National Institute for Standards and Technology.

In addition to having an influence on heat release rate, the location and configuration of exhaust and inlet openings determines air track (movement of smoke and air) and the path of fire spread. In this incident, the patio door providing access to the basement at the rear acted as an inlet, providing additional air to the fire. The front door and windows on the first floor opened for ventilation served as exhaust openings and provided a path for fire travel when the conditions in the basement rapidly transitioned to a fully developed fire.

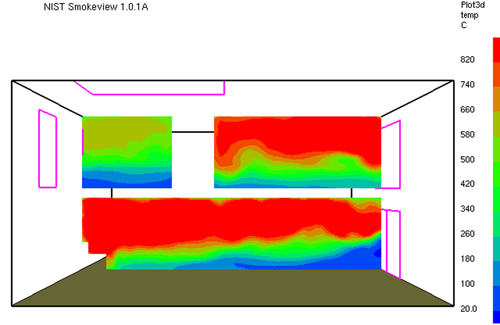
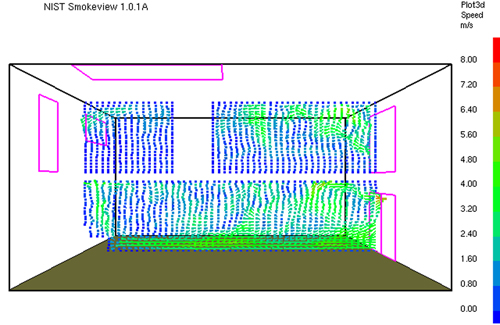
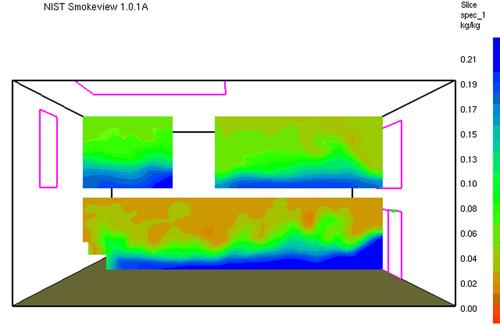
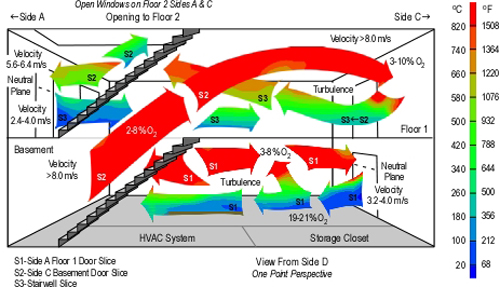
Figures 3-10 illustrate conditions at 200 seconds into the simulation, which relates to approximately 00:27 during the incident, the time at which the fire in the basement transitioned to a fully developed stage and rapidly extended up the basement stairway to Floor 1. Data is presented as a snapshot within a specific slice. Temperature and velocity data are provide for each slice (S1, S2, & S3 as illustrated in Figure 2).

Figure 3. Temperature Along Centerline of Basement Door Side C (S1) at 200 s

basement_door_temp_slice_sr

Note: From Simulation of the Dynamics of the Fire at 3146 Cherry Road NE Washington D.C., May 30, 1999, NISTR 6510 (p. 17) by Dan Madrzykowski and Robert Vettori, 2000, Gaithersburg, MD: National Institute for Standards and Technology.

Figure 4. Vector Representation of Velocity Along Centerline of Basement Door Side C (S1) at 200 s

basement_door_velocity_slice_sr

Note: From Simulation of the Dynamics of the Fire at 3146 Cherry Road NE Washington D.C., May 30, 1999, NISTR 6510 (p. 18) by Dan Madrzykowski and Robert Vettori, 2000, Gaithersburg, MD: National Institute for Standards and Technology.

Figure 5. Oxygen Concentration Along Centerline of Basement Door Side C (S1) at 200 s

basement_door_o2_slice_sr

Note: From Simulation of the Dynamics of the Fire at 3146 Cherry Road NE Washington D.C., May 30, 1999, NISTR 6510 (p. 23) by Dan Madrzykowski and Robert Vettori, 2000, Gaithersburg, MD: National Institute for Standards and Technology.

Figure 6. Temperature Slice Along Centerline of Basement Stairwell (S2) at 200 s

stairwell_temp_slice_sr

Note: From Simulation of the Dynamics of the Fire at 3146 Cherry Road NE Washington D.C., May 30, 1999, NISTR 6510 (p. 21) by Dan Madrzykowski and Robert Vettori, 2000, Gaithersburg, MD: National Institute for Standards and Technology.

Figure 7. Vector Representation of Velocity Along Centerline of Basement Stairwell (S2) at 200 s

stairwell_velocity_slice_sr

Note: From Simulation of the Dynamics of the Fire at 3146 Cherry Road NE Washington D.C., May 30, 1999, NISTR 6510 (p. 22) by Dan Madrzykowski and Robert Vettori, 2000, Gaithersburg, MD: National Institute for Standards and Technology.

Figure 8. Oxygen Concentration Along Centerline of Basement Stairwell (S2) at 200 s

stairwell_o2_slice_sr

Note: From Simulation of the Dynamics of the Fire at 3146 Cherry Road NE Washington D.C., May 30, 1999, NISTR 6510 (p. 24) by Dan Madrzykowski and Robert Vettori, 2000, Gaithersburg, MD: National Institute for Standards and Technology.

Figure 9. Temperature Slice Along Centerline of Floor 1 Door Side A (S3) at 200 s

front_door_temp_slice_sr

Note: From Simulation of the Dynamics of the Fire at 3146 Cherry Road NE Washington D.C., May 30, 1999, NISTR 6510 (p. 19) by Dan Madrzykowski and Robert Vettori, 2000, Gaithersburg, MD: National Institute for Standards and Technology.

Figure 10. Vector Representation of Velocity Along Centerline of Floor 1 Door Side A (S3) at 200 s

front_door_velocity_slice_sr

Note: From Simulation of the Dynamics of the Fire at 3146 Cherry Road NE Washington D.C., May 30, 1999, NISTR 6510 (p. 20) by Dan Madrzykowski and Robert Vettori, 2000, Gaithersburg, MD: National Institute for Standards and Technology.

Figure 11. Perspective Cutaway, Flow/Temperature, Velocity, and O2 Concentration

cherry_road_cutaway_sr

Figure 12. Thermal Exposure Limits in the Firefighting Environment

thermal_environment

Note: Adapted from Measurements of the firefighting environment. Central Fire Brigades Advisory Council Research Report 61/1994 by J.A. Foster & G.V. Roberts, 1995. London: Department for Communities and Local Government and Thermal Environment for Electronic Equipment Used by First Responders by M.K. Donnelly, W.D. Davis, J.R. Lawson, & M.J. Selepak, 2006, Gaithersburg, MD: National Institute of Standards and Technology.

Compartment Fire Thermal Hazards

The temperature of the atmosphere (i.e., smoke and air) is a significant concern in the fire environment, and firefighters often wonder or speculate about how hot it was in a particular fire situation. However, gas temperature in the fire environment is a bit more complex than it might appear on the surface and is only part of the thermal hazard presented by compartment fire.

Tissue temperature and depth of penetration determine the severity of a thermal burn. Temperature and penetration are dependent on the amount of energy absorbed and the duration of the thermal insult as well as the properties of human tissue. In a compartment fire, firefighters absorb energy from any substance that has a temperature above 37o C (98.6o F), including hot compartment linings, contents, the hot gas layer, and flames. The dominant mechanisms of heat transfer involved in this process are convection and radiation (although conduction through personal protective equipment is also a factor to be considered).

The total thermal energy received is described in joules per unit area. However, the speed or rate of energy is transferred may be more important when assessing thermal hazard. Heat (thermal) flux is used to define the rate of heat transfer and is expressed in kW/m2 (Btu/hr/ft2).

One way to understand the interrelated influence of radiant and convective heat transfer is to consider the following scenario. Imagine that you are standing outside in the shade on a hot, sunny day when the temperature is 38o C (100o F). As the ambient temperature is higher than that of your body, energy will be transferred to you from the air. If you move out of the shade, your body will receive additional energy as a result of radiant heat transfer from the sun.

Convective heat transfer is influenced by gas temperature and velocity. When hot gases are not moving or the flow of gases across a surface (such as your body or personal protective equipment) is slow, energy is transferred from the gases to the surface (lowering the temperature of the gases, while raising surface temperature). These lower temperature gases act as an insulating layer, slowing heat transfer from higher temperature gases further away from the surface. When velocity increases, cooler gases (which have already transferred energy to the surface) move away and are replaced by higher temperature gases. When velocity increases sufficiently to result in turbulent flow, hot gases remain in contact with the surface on a relatively constant basis, increasing convective heat flux.

Radiant heat transfer is influenced by proximity and temperature of the radiating body. Radiation increases by a factor of four when distance to the hot material is reduced by half. In addition, radiation increases exponentially (as a function of the fourth power) as absolute temperature increases.

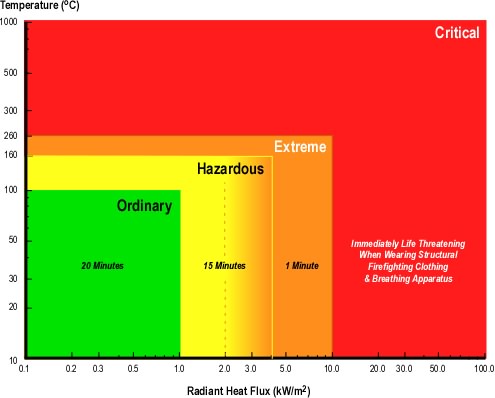
Thermal hazard may be classified based on hot gas temperature and radiant heat flux (Foster & Roberts, 1995; Donnelly, Davis, Lawson, & Selpak, 2006) with temperatures above 260o C (500o F) and/or radiant heat flux of 10 kW/m2 (3172 Btu/hr/ft2) being immediately life threatening to a firefighter wearing a structural firefighting ensemble (including breathing apparatus). National Institute of Standards and Technology (NIST) experiments in a single compartment show post flashover gas temperatures in excess of 1000o C (1832o F) and heat flux at the floor may exceed 170 kW/m2 (Donnelly, Davis, Lawson, & Selpak, 2006). Post flashover conditions in larger buildings with more substantial fuel load may be more severe!

Figure 11 integrates temperature, velocity, and oxygen concentration data from the simulation (Figures 3-10). Detail and accuracy is sacrificed to some extent in order to provide a (somewhat) simpler view of conditions at 200 seconds into the simulation (approximately 00:27 incident time). Note that as in individual slices, data is presented as a range due to uncertainty in the computer model.

Alternative Model

In addition to modeling fire dynamics based on incident conditions and tactical operations as they occurred, NIST also modeled the incident with a slightly different ventilation profile.

The basic input for the alternate simulation was the same as the simulation of actual incident conditions. Ventilation openings and timing was the same, with one exception; the sliding glass door on Floor 1, Side C was opened at 120 s into the simulation. Conditions in the basement during the alternative simulation were similar to the first. However, on Floor 1, the increase in ventilation provided by the sliding glass door on Side C resulted in a shallower hot gas layer and cooler conditions at floor level. A side-by-side comparison of the temperature gradients in these two simulations is provided in Figure 13.

Figure 13. Comparison of Temperature Gradients Along Centerline of Basement Stairwell (S2) at 200 s

stairwell_slice_comparison_sr1

Note: Adapted from Simulation of the Dynamics of the Fire at 3146 Cherry Road NE Washington D.C., May 30, 1999, NISTR 6510 (p. 21 & 27) by Dan Madrzykowski and Robert Vettori, 2000, Gaithersburg, MD: National Institute for Standards and Technology.

The NIST Report (Madrzykowski & Vettori, 2000) identified that the significant difference between these two simulations is in the region close to the floor. In the alternative simulation (Floor 1, Side C Sliding Glass Door Open) between the doorway to the basement and the sofa, the temperatures from approximately 0.6 m (2 ft) above the floor, to floor level are in the range of 20 C to 100 C (68F to 212 F), providing at least an 80 C (176 F) temperature reduction.

While this is a considerable reduction in gas temperature, it is essential to also consider radiant heat flux from the hot gas layer. Given the temperature of the hot gases from the ceiling level to a depth of approximately 3′ (0.9 m), the heat flux at the floor would likely have been in the range of 15-20 kW/m2 (or greater).

Questions

  1. Temperatures vary widely at a given elevation above the floor. Consider the slices illustrated in Figures 3, 6, and 9, and identify factors that may have influenced these major differences in temperature.
  2. How might the variations in temperature illustrated in Figures 3, 6, and9 and location of Firefighters Phillips (basement doorway), Mathews (living room, C/D corner), and Morgan (between Phillips & Mathews) have influenced their injuries?
  3. Examine the velocity of gas movement illustrated in Figures 4, 7, and 10 and integrated illustration conditions in Figure 11. How does this correlate to the photos in Figure 1 illustrating incident conditions at approximately 00:28?
  4. Explain how the size and configuration of ventilation openings resulted in a bi-directional air track at the basement door on Side C.
  5. How did the velocity of hot gases in the stairwell and living room influence the thermal insult to Firefighters Phillips, Mathews, and Morgan? What factors caused the high velocity flow of gases from the basement stairwell doorway into the living room?
  6. Rescue 1B noted that the floor in the living room was soft while conducting primary search at approximately 00:30. Why didn’t the parallel chord trusses in the basement fail sooner? Is there a potential relationship between fire behavior and performance of the engineered floor support system in this incident?
  7. How might stability of the engineered floor support system have differed if the sliding glass door in the basement had failed prior to the fire departments arrival? Why?
  8. How might the double pane glazing on the windows and sliding glass doors have influenced fire development in the basement? How might fire development differed if these building openings had been fitted with single pane glazing?
  9. What was the likely influence of turbulence in the flow of hot gases and cooler air on combustion in the basement? What factors influenced this turbulence (examine Figures 4, 7, and 10) illustrating velocity of flow and floor plan illustrated in conjunction with the second question)?
  10. How did conditions in the area in which Firefighters Phillips, Mathews, and Morgan were located correlate to the thermal exposure limits defined in Figure 12? How did this change in the alternate scenario? Remember to consider both temperature and heat flux.

Extended Learning Activity

The Cherry Road case study provides an excellent opportunity to develop an understanding of the influence of building factors, burning regime, ventilation, and tactical operations on fire behavior. These lessons can be extended by comparing and contrasting this case with other cases such as the 1999 residential fire in Keokuk, Iowa that took the lives Assistant Chief Dave McNally, Firefighter Jason Bitting, and Firefighter Nathan Tuck along with three young children. For information on this incident see NIOSH Death in the Line of Duty Report F2000-4, NIST report Simulation of the Dynamics of a Fire in a Two Story Duplex, NIST IR 6923.and video animation of Smokeview output from modeling of this incident

Master Your Craft

Ed Hartin, MS, EFO, MIFireE, CFO

References

District of Columbia (DC) Fire & EMS. (2000). Report from the reconstruction committee: Fire at 3146 Cherry Road NE, Washington DC, May 30, 1999. Washington, DC: Author.

Madrzykowski, D. & Vettori, R. (2000). Simulation of the Dynamics of the Fire at 3146 Cherry Road NE Washington D.C., May 30, 1999, NISTR 6510. August 31, 2009 from http://fire.nist.gov/CDPUBS/NISTIR_6510/6510c.pdf

National Institute for Occupational Safety and Health (NIOSH). (1999). Death in the line of duty, Report 99-21. Retrieved August 31, 2009 from http://www.cdc.gov/niosh/fire/reports/face9921.html

Townhouse Fire: Washington, DC:
Computer Modeling

Monday, September 28th, 2009

This post continues study of an incident in a townhouse style apartment building in Washington, DC with examination of the extreme fire behavior that took the lives of Firefighters Anthony Phillips and Louis Mathews.

A Quick Review

Prior posts in this series, Fire Behavior Case Study of a Townhouse Fire: Washington, DC, Townhouse Fire: Washington, DC-What Happened,and Townhouse Fire: Washington, DC-Extreme Fire Behavior examined the building and initial tactical operations at this incident. The fire occurred in the basement of a two-story, middle of building, townhouse apartment with a daylight basement. This configuration provided at grade entrances to Floor 1 on Side A and the Basement on Side C.

Engine 26, the first arriving unit reported heavy smoke showing from Side A and observed a bi-directional air track at the open front door. Engines 26 and 10 operating from Side A deployed hoselines into the first floor to locate the fire. Engine 17, the second due engine, was stretching a hoseline to Side C, but had insufficient hose and needed to extend their line. Truck 4, the second due truck, operating from Side C opened a sliding glass door to the basement to conduct search and access the upper floors (prior to Engine 17’s line being in position). When the door on Side C was opened, Truck 4 observed a strong inward air track. As Engine 17 reached Side C (shortly after Rescue 1 and a member of Truck 4 entered the basement) and asked for their line to be charged. Engine 17 advised Command that the fire was small.

Conditions changed quickly after the door on Side C was opened, as conditions in the basement rapidly transitioned to a fully developed fire with hot gases and flames extending up the interior stairway trapping Firefighters Phillips, Mathews, and Morgan. Confusion about building configuration (particularly the number of floors and location of entry points on Side A and C) delayed fire attack due to concern for opposing hoselines.

Modeling of the Cherry Road Incident

National Institute for Standards and Technology (NIST) performed a computer model of fire dynamics in the fire at 3146 Cherry Road (Madrzykowski and Vettori, 2000) using the NIST Fire Dynamics Simulator (FDS) software. This is one of the first cases where FDS was used in forensic fire scene reconstruction.

Fire Modeling

Fire modeling is a useful tool in research, engineering, fire investigation, and learning about fire dynamics. However, effective use of this tool and the information it provides requires understanding of its capabilities and limitations.

Models, such as the National Institute of Standards and Technology (NIST) Fire Dynamics Simulator (FDS) relay on computational fluid dynamics (CFD). CFD models define the fire environment by dividing it into small, rectangular cells. The model simultaneously solves mathematical equations for combustion, heat transfer, and mass transport within and between cells. When used with a graphical interface such as NIST Smokeview, output can be displayed in a three-dimensional (3D) visual format.

Models must be validated to determine how closely they match reality. In large part this requires comparison of model output to full scale fire tests under controlled conditions. When used for forensic fire scene reconstruction, it may not be feasible to recreate the fire to test the model. In these situations, model output is compared to physical evidence and interview data to determine how closely key aspects of model output matched events as they occurred. If model output reasonably matches events as they occurred, it is likely to be useful in understanding the fire dynamics involved in the incident.

It is crucial to bear in mind that fire models do not provide a reconstruction of the reality of an event. They are simplified representation of reality that will always suffer from a certain lack of accuracy and precision. Under the condition that the user is fully aware of this status and has an extensive knowledge of the principles of the models, their functioning, their limitations and the significance attributed to their results, fire modeling becomes a very powerful tool (Delemont & Martin, J., 2007, p. 134).

FDS output included data on heat release rate, temperature, oxygen concentration, and velocity of gas (smoke and air) movement within the townhouse. As indicated above, model output is an approximation of actual incident conditions.

In large scale fire tests (McGrattan, Hamins, & Stroup, 1998, as cited in Madrzykowski and Vettori, 2000), FDS temperature predictions were found to be within 15% of the measured temperatures and FDS heat release rates were predicted to within 20% of the measured values. For relatively simple fire driven flows such as buoyant plumes and flows through doorways, FDS predictions are within experimental uncertancies (McGrattan, Baum, & Rehm, 1998, as cited in Madrzykowski and Vettori, 2000).

Results presented in the NIST report on the fire at 3146 Cherry Road were presented as ranges to account for potential variation between model output and actual incident conditions.

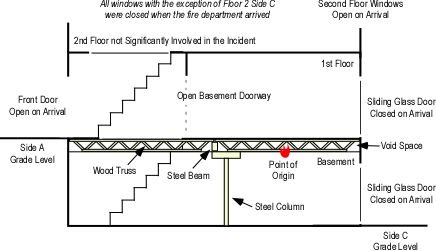
Heat release rate is dependent on the characteristics and configuration of the fuel packages involved and available oxygen. In a compartment fire, available oxygen is dependent on the ventilation profile (i.e., size and location of compartment openings). The ventilation profile can change over time due to the effects of the fire (e.g., failure of window glazing) as well as human action (i.e., doors left open by exiting occupants, tactical ventilation, and tactical anti-ventilation)

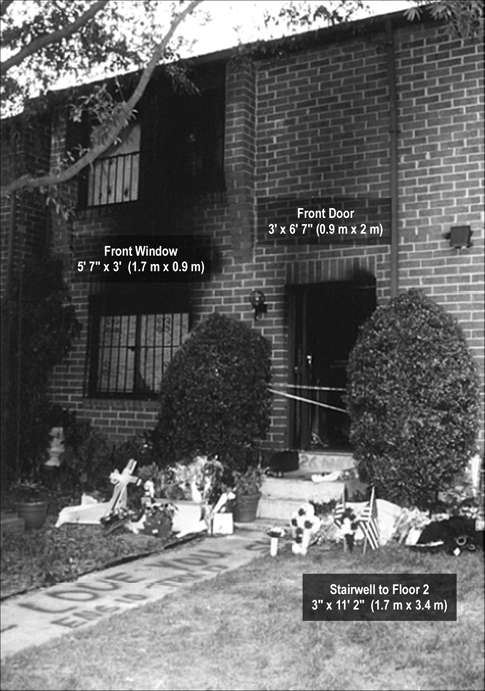
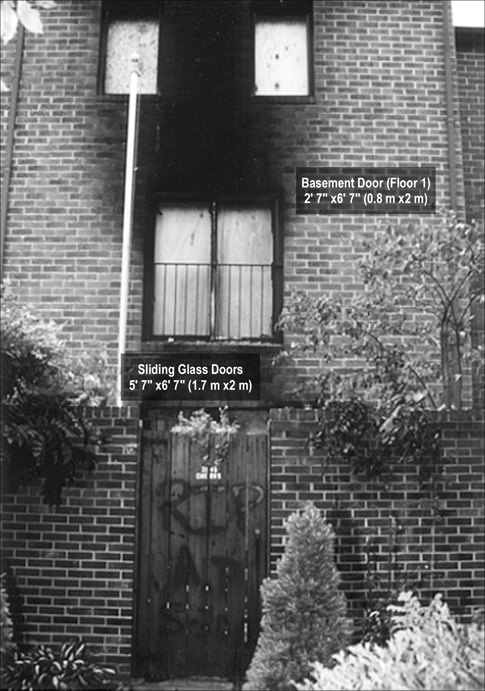
In this incident there were a number of changes to the ventilation profile. Most significant of which were, 1) the occupant opened the second floor windows on Side C (see Figure 3), 2) the occupant left the front door open as they exited (see Figures 1 &2 ), 3) tactical ventilation of the first floor window on Side A, and opening of the sliding glass door in the basement on Side C (see Figures 1-3). In addition, the open door in the basement stairwell and open stairwell between the Floors 1 and 2 also influenced the ventilation profile (see Figure 1).

Figure 1. Cross Section of 3146 Cherry Road NE

cherry_road_cross_section

Figure 2. Side A 3146 Cherry Road NE

side_a_post_fire

Figure 3. Side C 3146 Cherry Road NE

side_c_post_fire

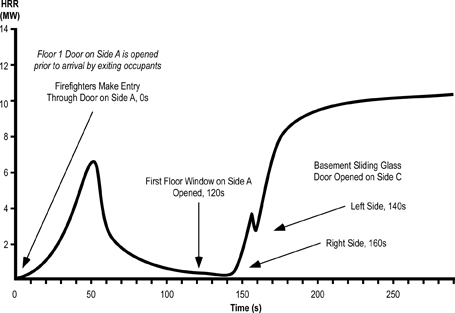
Figure 4 illustrates the timing of changes to the ventilation profile and resulting influence on heat release rate in modeling this incident. A small fire with a specific heat release rate (HRR) was used to start fire growth in the FDS simulation. In the actual incident it may have taken hours for the fire to develop flaming combustion and progression into the growth stage. Direct comparison between the simulation and incident conditions began at 100 seconds into the simulation which corresponds to approximately 00:25 during the incident.

Figure 4. FDS Heat Release Rate Curve

cherry_road_hrr_curve

Note: Adapted from Simulation of the Dynamics of the Fire at 3146 Cherry Road NE Washington D.C., May 30, 1999, NISTR 6510 (p. 14) by Dan Madrzykowski and Robert Vettori, 2000, Gaithersburg, MD: National Institute for Standards and Technology.

Questions

The following questions are based on heat release rate data from the FDS model presented in Figure 4.

  1. What was the relationship between changes in ventilation profile and heat release rate?
  2. What would explain the rapid increase in heat release rate after the right side of the basement sliding glass door is opened?
  3. Why might the heat release rate have dropped slightly prior to opening of the left side of the basement sliding glass door?
  4. Why did the heat release rate again increase rapidly to in excess of 10 MW after the left side of the basement sliding glass door was opened?
  5. How does data from the FDS model correlate to the narrative description of events presented in prior posts about this incident (Fire Behavior Case Study of a Townhouse Fire: Washington, DC, Townhouse Fire: Washington, DC-What Happened,and Townhouse Fire: Washington, DC-Extreme Fire Behavior)?

More to Follow

In addition to heat release rate data the computer modeling of this incident provided data on temperature, oxygen concentration, and gas velocity. Visual presentation of this data provides a more detailed look at potential conditions inside the townhouse during the fire. The next post in this series will present and examine graphic output from Smokeview to aid in understanding the fire dynamics and thermal environment encountered during this incident.

Master Your Craft

Ed Hartin, MS, EFO, MIFireE, CFO

References

District of Columbia (DC) Fire & EMS. (2000). Report from the reconstruction committee: Fire at 3146 Cherry Road NE, Washington DC, May 30, 1999. Washington, DC: Author.

Madrzykowski, D. & Vettori, R. (2000). Simulation of the Dynamics of the Fire at 3146 Cherry Road NE Washington D.C., May 30, 1999, NISTR 6510. August 31, 2009 from http://fire.nist.gov/CDPUBS/NISTIR_6510/6510c.pdf

National Institute for Occupational Safety and Health (NIOSH). (1999). Death in the line of duty, Report 99-21. Retrieved August 31, 2009 from http://www.cdc.gov/niosh/fire/reports/face9921.html

Incipient Stage Fires:
Key Fire Behavior Indicators

Thursday, September 24th, 2009

Building Factors, Smoke, Air Track, Heat, and Flame (B-SAHF) are critical fire behavior indicators. Understanding the indicators is important, but more important is the ability to integrate these factors in the process of reading the fire as part of size-up and dynamic risk assessment.

This post reviews application of the B-SAHF organizing scheme to recognizing and identifying stages of fire development and burning regime.

Compartment Fire Development

Part of the process of reading the fire involves recognizing the stages of fire development and burning regime (e.g., fuel or ventilation controlled). Remember that fire conditions can vary considerably throughout the building with one compartment containing a fully developed fire, an adjacent compartment in the growth stage, and still other compartments yet uninvolved. Similarly, burning regime may vary from compartment to compartment. Recognizing the stages of fire development and burning regime allows firefighters to predict what is likely to happen next (if action is not taken), potential changes due to unplanned ventilation (such as failure of a window), and the likely effect of tactical action.

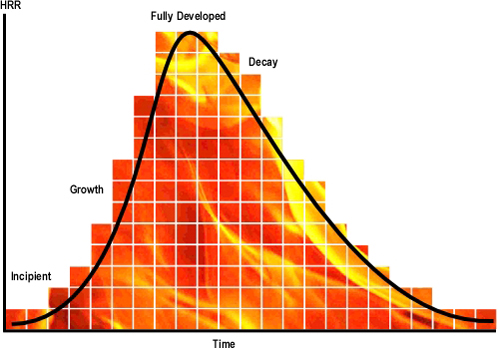
Compartment fire development can be described as being comprised of four stages: incipient, growth, fully developed and decay (see Figure 1). Flashover is not a stage of development, but simply a rapid transition between the growth and fully developed stages.

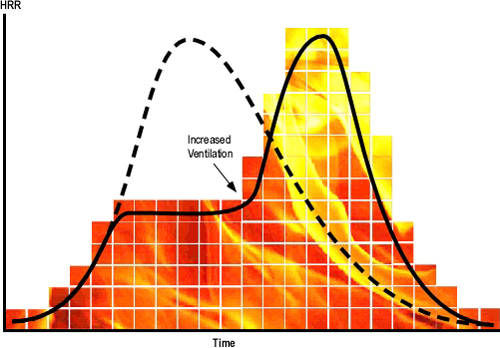
Figure 1. Heat Release Rate (HRR) and Fire Development

fire_development_curve_basic

Compartment fires do not always follow the simple, idealized fire development curve illustrated in Figure 1. The speed with which the fire develops, peak heat release rate, and duration of burning are dependent on both the characteristics of the fuel involved and ventilation profile (available oxygen).

Hazard of Ventilation Controlled Fires

Many if not most fires that have progressed beyond the incipient stage when the fire department arrives are ventilation controlled. This means that the heat release rate (the fire’s power) is limited by the ventilation profile, in particular, the existing openings.

If ventilation is increased, either through tactical action or unplanned ventilation resulting from effects of the fire (e.g., failure of a window) or human action (e.g., exiting civilians leaving a door open), heat release rate will increase, potentially resulting in a ventilation induced flashover as illustrated in Figure 2.

Figure 2. Ventilation Induced Flashover

vent_induced_flashover_curve

Incipient Stage

Going back to the basics of fire behavior, ignition requires heat, fuel, and oxygen. Once combustion begins, development of an incipient fire is largely dependent on the characteristics and configuration of the fuel involved (fuel controlled fire). Air in the compartment provides adequate oxygen to continue fire development. During this initial phase of fire development, radiant heat warms adjacent fuel and continues the process of pyrolysis. A plume of hot gases and flame rises from the fire and mixes with the cooler air within the room. This transfer of energy begins to increase the overall temperature in the room. As this plume reaches the ceiling, hot gases begin to spread horizontally across the ceiling. Transition beyond the incipient stage is difficult to define in precise terms. However, as flames near the ceiling, the layer of hot gases becomes more clearly defined and increase in volume, the fire has moved beyond its incipient phase and (given adequate oxygen) will continue to grow more quickly.

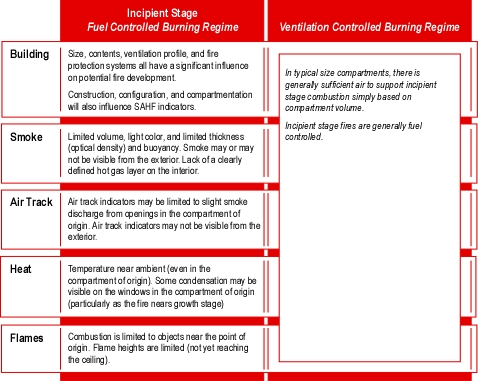
Depending on the size of the compartment and ventilation profile, there may only be a limited indication (or no indication at all) from the exterior of the building that an incipient stage fire is burning within. Incipient stage indicators are listed in Figure 3

Figure 3. B-SAHF Indicators of an Incipient Stage Fire

incipient_indicators

Application Exercise

Consider the following situation and how critical fire behavior indicators would present. Use the B-SAHF model to help you frame your answers.

You have responded to a fire in a one-story single family dwelling of wood frame construction. An incipient fire is burning in a bedroom on the Alpha Bravo corner of the structure. The fire is limited to a plastic trash can containing waste paper which is located next to the bed.

  • What conditions would you expect to see from the exterior of the structure?
  • What indicators may be visible from the front door as you make entry?
  • What might you observe traveling through the living room and down the hallway?
  • What conditions would you find in the bedroom?

It is essential to think about what you are likely to find inside when observing fire behavior indicators from the exterior and performing a risk assessment. After making entry, consider if conditions are different than you anticipated.

  • Why might this be the case?
  • What differences in conditions would be cause for concern?

Master Your Craft

More to Follow

The next post in this series will continue examination of the relationship between the B-SAHF indicators, fire development, and burning regime with a look at growth stage fires in both fuel and ventilation controlled burning regimes.

Ed Hartin, MS, EFO, MIFireE, CFO