Language is Important
Language has a substantial influence on what and how we think. “What a man cannot state he does not perfectly know, and conversely the inability to put his thoughts into words sets a boundary to his thought” (Newbolt, Bailey, Baines, Boas, Davies, Enright, et al., 1921, p. 20).

While the authors of this statement were focused on English language education in English schools in the 1920’s, the underlying concept applies equally well today. Language is the foundation of understanding. While this is true in day-to-day life, it is equally (or even more) important when dealing with scientific concepts and phenomena related to firefighting.
While construction and fuel loading vary to some extent, fire services around the world are challenged by similar fire problems in the built environment. Each of us faces the same processes of compartment fire development and extreme fire behavior phenomena such as flashover, backdraft, and smoke explosion. However, our understanding and communication about these important processes and phenomena are limited by lack of a common language. In many cases terms have more than one definition. In addition, definitions are often unclear and imprecise.
Shared Concepts
In philosophy, ontology is the study of the nature of reality, categories of being, and their relations; what entities can exist and how they can be grouped, related within a hierarchy, and divided based on their similarities and differences. Ontology is a system of concepts that provides a shared vocabulary that can be used to describe and think about a particular domain.
We do not really have an ontology that encompasses fire behavior phenomena such as flashover, backdraft, smoke explosion, and the like. As Dr. Stefan Svennson so astutely observes, it is complicated and there may not always be a clearly defined differences between phenomena. However, going back to the opening paragraph of this post, I contend that a shared language is necessary for us to understand and mitigate the hazards we face as a result of rapid fire progress. Hopefully this post will engage you in this ongoing effort.
Extreme Fire Behavior
Terms such as flashover, backdraft, and smoke explosion are often used to describe phenomena involving rapid fire progression in compartment fires. Currently accepted definitions provide a starting point for developing improved clarity. As a starting point, I have examined definitions of extreme fire behavior phenomena from the following sources:
- International Standards Organization (ISO)
- National consensus standards organizations (e.g., National Fire Protection Association, Fire Protection Association)
- International or national professional associations (e.g., Institution of Fire Engineers, Society of Fire Protection Engineers)
- Recognized texts
Consider the similarities and differences in the following definitions and give some thought to the questions that follow.
Flashover: 1) Stage of fire transition to a state of total surface involvement in a fire of combustible materials within an enclosure’ (ISO 13943, 2008, 4.156). 2) A transitional phase in the development of a compartment fire in which surfaces exposed to thermal radiation reach ignition temperature more or less simultaneously and fire spreads rapidly throughout the space resulting in full room involvement or total involvement of the compartment or enclosed area (NFPA 921-2007).
Discussion: This transition is often assumed to take place between the growth and fully developed stages. However, neither the ISO nor NFPA definition specifies this. In addition, while the NFPA definition indicates that this transition is extremely rapid (i.e., more or less simultaneously), the ISO definition does not describe the speed with which the transition to total surface involvement occurs.
- Is the occurrence of flashover limited to the transition between growth and fully developed stages of fire development?
- Can flashover result from increasing ventilation to a ventilation controlled fire (vent induced flashover)? If yes, how does this differ from backdraft?
- Can a fire reach the fully developed stage without transitioning through flashover?
Backdraft: 1) Rapid flaming combustion caused by the sudden introduction of air into a confined oxygen-deficient space that contains hot products of incomplete combustion. In some cases, these conditions can result in an explosion (ISO 13943, 2008, 4.21). 2) A deflagration resulting from the sudden introduction of air into a confined space containing oxygen-deficient products of incomplete combustion (NFPA 921, 2008, 3.3.14).� 3) A phenomenon that occurs when a fire takes place in a confined area such as a sealed aircraft fuselage and burns undetected until most of the oxygen within is consumed. The heat continues to produce flammable gases, mostly in the form of carbon monoxide. These gases are heated above their ignition temperature and when a supply of oxygen is introduced, as when normal entry points are opened, the gases could ignite with explosive force (NFPA 402, 2008).
Discussion: The ISO definition is considerably more broad than that specified in NFPA 921 and as such would be inclusive of phenomena such as ventilation induced flashover as well deflagration resulting from introduction of air to an extremely ventilation controlled fire. The definition of backdraft in NFPA 402, Guide for Aircraft Rescue and Firefighting Operations illustrates the common misconception that carbon monoxide is the primary gas phase fuel in a backdraft. There is no scientific evidence that this is the case. Both NFPA definitions indicate that backdraft is explosive in nature (e.g., deflagration) while the ISO definition indicates that this is a possibility, but not a requisite outcome.
- How does backdraft differ from a vent induced flashover? This is essentially the same question as before, but this time, think about it from the backdraft perspective.
- If there is a difference between vent induced flashover and backdraft, what is different (about the nature of the phenomena, requisite conditions, and initiating event(s))?
- Many firefighters believe that backdraft requires high temperature (resulting in auto-ignition following an increase in ventilation), yet this is not mentioned in any of the definitions. Is this the case?
- Is a backdraft always an explosive event?
Fire Gas Ignition: Ignition of accumulated unburned pyrolysis products and flammable products of incomplete combustion existing in or transported into a flammable state (Grimwood, Hartin, McDonough, & Raffel, 2005)
Discussion: In 3D Firefighting, Grimwood uses the term Fire Gas Ignition as a broad category of phenomena including smoke (fire gas) explosion, flash fire, and a number of other fire behavior phenomena.
- What differentiates phenomena classified as fire gas ignitions from backdraft, or for that matter flashover?
- If there is a common theme, is it useful to have an overarching category such as fire gas ignition?
Smoke Explosion: 1) See Backdraft (NFPA 921, 2008). 2) When unburnt gases from an under-ventilated fire flow through leakages into a closed space connected to the fire room, the gases there can mix very well with air to form a combustible gas mixture. A small spark is then enough to cause a smoke gas explosion (Karlsson & Quintiere, 2000). 3) A smoke gas explosion results from ignition of a confined mass of smoke gases and air that fall within the flammable range. This may result in a significant increase in pressure within the compartment (paraphrased from Bengtsson, 2001).
Discussion: In the past, the terms smoke explosion and backdraft were frequently used synonymously (and still used this way within NFPA 921). However, smoke explosion is a substantively different phenomenon as evidenced by the definitions provided by Karlsson & Quintiere (2000) and Bengtsson (2001). Drysdale (1998) also discusses this phenomenon, and while not providing a definition per say, delineates the difference between smoke explosion and backdraft as different phenomena.
- How are smoke explosion and backdraft different?
- What differentiates smoke explosion from flash fire?
- The phenomenon of smoke explosion as defined in various texts requires a mixture of fuel and air within the flammable range. If this flammable mixture is achieved by an increase in ventilation (adding air to a rich mixture of air and fuel), would piloted ignition result in a smoke explosion or backdraft?
Flash Fire: A fire that spreads rapidly through a diffuse fuel, such as dust, gas, or the vapors of an ignitable liquid, without the production of damaging pressure (NFPA 921, 2008, 3.3.72)
Discussion: While this definition appears reasonably clear when taken by itself, how does this differ from rollover, or for that matter flashover?
- What differentiates flash fire from other phenomena such as rollover (flameover) where fire spread rapidly through gas phase fuel in the upper layer?
- While the term “flash” infers a brief occurrence, the definition does not clearly define the duration of this phenomenon. Is this different from the rapid transition to a fully developed fire that results from flashover?
- What differentiates flash fire from a smoke explosion (the NFPA definition of flash fire provides a fuzzy hint, but is this clear enough)?
For a longer and more detailed examination of the definitions of flashover and backdraft, see The Current Knowledge and Training Regarding Flashover, Backdraft, and Other Rapid Fire Progression Phenomenon (Gorbett & Hopkins, 2007).
What Next?
Over the next couple of months, I will be working to develop a discussion (in a variety of formats) to develop a common framework and working definitions that will aid us in talking about fire behavior phenomena that present a significant threat to firefighters (i.e., extreme fire behavior). I invite you to be part of this process! More information will be provided in subsequent posts.
Ed Hartin, MS, EFO, MIFireE, CFO
References
Bengtsson, L. (2001). Enclosure Fires. Karlstad, Sweden: R�ddnings Verket.
Drysdale, D. (2000). An introduction to fire dynamics. Chichester, England: John Wiley & Sons.
Gorbett, G. & Hopkins, R. (2007). The Current Knowledge and Training Regarding Flashover, Backdraft, and Other Rapid Fire Progression Phenomenon. Retrieved March 19, 2009 from http://www.kennedy-fire.com/backdraft%20paper.pdf.
Grimwood, P., Hartin, E., McDonough, J., & Raffel, S. (2005). 3D firefighting: Training , techniques, and tactics. Stillwater, OK: Fire Protection Publications.
Karlsson, B. & Quintiere, J.G. (2000). Enclosure fire dynamics. Boca Raton, FL: CRC Press.
National Fire Protection Association. (2008) NFPA 402 Guide for aircraft rescue and fire-fighting operations. Quincy, MA: Author.
National Fire Protection Association. (2008) NFPA 921 Guide for fire and explosion investigations. Quincy, MA: Author.
Newbolt, H., Bailey, J., Baines, K., Boas, F., Davies, H., Enright, D., et al. (1921). Teaching of English in England.� Retrieved March 17, 2009 from http://ia340921.us.archive.org/2/items/teachingofenglis00greaiala/teachingofenglis00greaiala.pdf


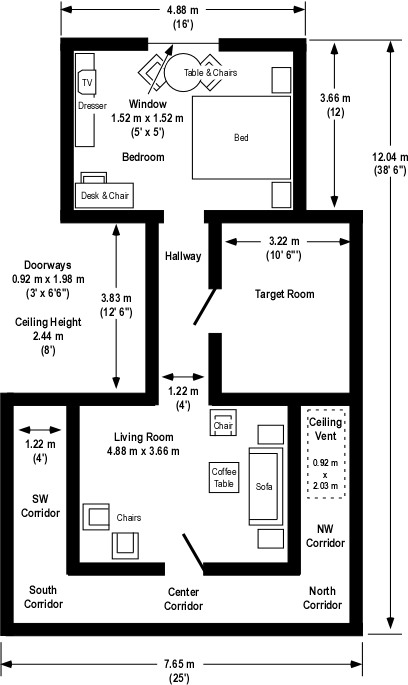
 Note: Adapted from Firefighting Tactics Under Wind Driven Conditions.


