Posts Tagged ‘fire development’

Townhouse Fire: Washington, DC
Extreme Fire Behavior

Monday, September 21st, 2009

This post continues study of an incident in a townhouse style apartment building in Washington, DC with examination of the extreme fire behavior that took the lives of Firefighters Anthony Phillips and Louis Mathews.

A Quick Review

Prior posts in this series, Fire Behavior Case Study of a Townhouse Fire: Washington, DC and Townhouse Fire: Washington, DC-What Happened examined the building and initial tactical operations at this incident. The fire occurred in the basement of a two-story, middle of building, townhouse style apartment with a daylight basement. This configuration provided an at grade entrance to the Floor 1 on Side A and at grade entrance to the Basement on Side C.

Engine 26, the first arriving unit reported heavy smoke showing from Side A and observed a bi-directional air track at the open front door. First alarm companies operating on Side A deployed hoselines into the first floor to locate the fire. Engine 17, the second due engine, was stretching a hoseline to Side C, but had insufficient hose and needed to extend their line. Truck 4, the second due truck, operating from Side C opened a sliding glass door to the basement to conduct search and access the upper floors (prior to Engine 17’s line being in position). When the door on Side C was opened, Truck 4 observed a strong inward air track. As Engine 17 reached Side C (shortly after Rescue 1 and a member of Truck 4 entered the basement) and asked for their line to be charged, and Engine 17 advised Command that the fire was small.

Extreme Fire Behavior

Proceeding from their entry point on Side C towards the stairway to Floor 1 on Side A, Rescue 1B and the firefighter from Truck 4 observed fire burning in the middle of the basement room. Nearing the stairs, temperature increased significantly and they observed fire gases in the upper layer igniting. Rescue 1B and the firefighter from Truck 4 escaped through the basement doorway on Side C as the basement rapidly transitioned to a fully developed fire.

Figure 1. Timeline Leading Up to the Extreme Fire Behavior Event
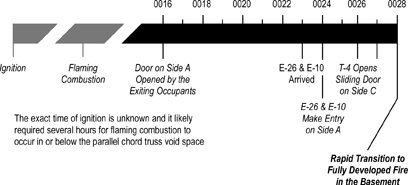
short_timeline_sr

The timeline illustrated in Figure 1 is abbreviated and focuses on a limited number of factors. A detailed timeline, inclusive of tactical operations, fire behavior indicators, and fire behavior is provided in a subsequent section of the case.

After Engine 17’s line was charged, the Engine 17 officer asked Command for permission to initiate fire attack from Side C. Command denied this request due to lack of contact with Engines 26 and 10 and concern regarding opposing hoselines. Due to their path of travel around Side B of the building, Engine 17 had not had a clear view of Side A and thought that they were at a doorway leading to Floor 1 (rather than the Basement). At this point, neither the companies on Side C nor Command recognized that the building had three levels on Side C and two levels on Side A.

At this point crews from Engine 26 and 10 are operating on Floor 1 and conditions begin to deteriorate. Firefighter Morgan (Engine 26) observed flames at the basement door in the living room (see Figure 8 which illustrates fire conditions in the basement as seen from Side C). Firefighter Phillips (Engine 10) knocked down visible flames at the doorway, but conditions continued to deteriorate. Temperature increased rapidly while visibility dropped to zero.

As conditions deteriorated, Engine 26’s officer feels his face burning and quickly exits (without notifying his crew). In his rapid exit through the hallway on Floor 1, he knocked the officer from Engine 10 over. Confused about what was happening Engine 10’s officer exited the building as well (also without notifying his crew). Engine 26’s officer reports to Command that Firefighter Mathews was missing, but did not report that Firefighter Morgan was also missing. Appearing dazed, Engine 10’s officer did not report that Firefighter Phillips was missing.

Figure 2. Conditions on Side C at Aproximately 00:28
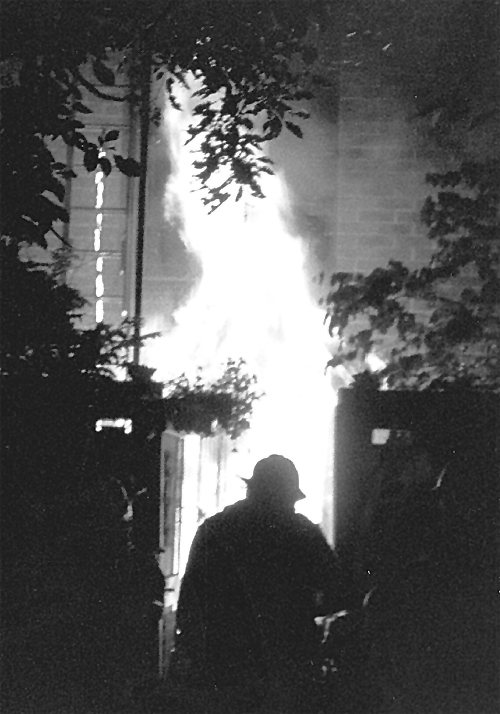
fire_side_c_sr

Note: From Report from the Reconstruction Committee: Fire at 3146 Cherry Road NE, Washington DC, May 30, 1999, p. 32. District of Columbia Fire & EMS, 2000.

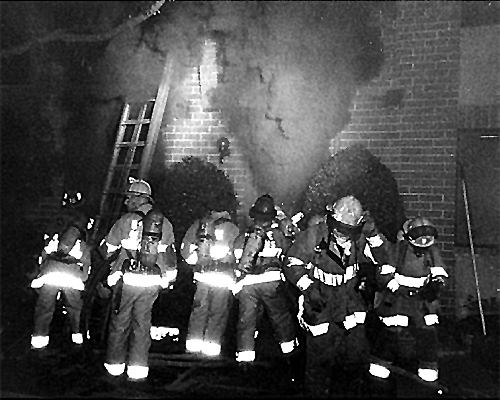
Figure 3. Conditions on Side A at Aproximately 00:28
fire_side_a_sr

Note: From Report from the Reconstruction Committee: Fire at 3146 Cherry Road NE, Washington DC, May 30, 1999, p. 29. District of Columbia Fire & EMS, 2000.

Firefighter Rescue Operations

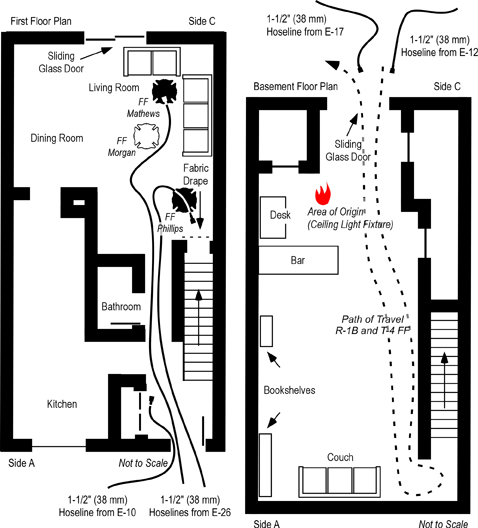
After the exit of the officers from Engine 26 and Engine 10, the three firefighters (Mathews, Phillips, and Morgan) remained on Floor 1. However, neither Command (Battalion 1) nor a majority of the other personnel operating at the incident recognized that the firefighters from Engines 26 and 10 had been trapped by the rapid extension of fire from the Basement to Floor 1 (see Figure 4).

While at their apparatus getting a ladder to access the roof from Side B, Truck 4B observed the rapid fire development in the basement and pulled a 350′ 1-1/2″ (107 m 38 mm) line from Engine 12 to Side C, backing up Engine 17.

Figure 4. Location of Firefighters on Floor 1
location_of_ffs_sr

Note: Adapted from Report from the Reconstruction Committee: Fire at 3146 Cherry Road NE, Washington DC, May 30, 1999, p. 18 & 20. District of Columbia Fire & EMS, 2000 and Simulation of the Dynamics of the Fire at 3146 Cherry Road NE, Washington D.C., May 30, 1999, p. 12-13, by Daniel Madrzykowski & Robert Vettori, 2000. Gaithersburg, MD: National Institute of Standards and Technology.

Engine 17 again contacted Command (Battalion 1) and requested permission to initiate an exterior attack from Side C. However, the officer of Engine 17 mistakenly advised Command that there was no basement entrance and that his crew was in position to attack the fire on Floor 1. Unable to contact Engines 10 and 26, Command denied this request due to concern for opposing hoselines. With conditions worsening, Command (Battalion 1) requested a Task Force Alarm at 00:29, adding another two engine companies, truck company, and battalion chief to the incident.

Firefighter Phillips (E-10) attempted to retreat from his untenable position at the open basement door. He was only able to travel a short distance before he collapsed. Firefighter Morgan (E-26) heard a loud scream to his left and then a thud as if someone had fallen to the floor (possibly Firefighter Mathews (E-26)). Firefighter Morgan found the attack line and opened the nozzle on a straight stream, penciling the ceiling twice before following the hoseline out of the building (to Side A). Firefighter Morgan exited the building at approximately 00:30.

Rescue 1B entered the structure on Floor 1, Side A to perform a primary search. They crawled down the hallway on Floor 1 towards Side C until they reached the living room and attempted to close the open basement door but were unable to do so. Rescue 1 B did not see or hear Firefighters Mathews (E-26) and Phillips (E-10) while working on Floor 1. Rescue 1B noted that the floor in the living room was spongy. The Rescue 1 Officer ordered his B Team to exit, but instead they returned to the front door and then attempted to search Floor 2, but were unable to because of extremely high temperature.

Unaware that Firefighter Phillips (E-10) was missing, Command tasked Engine 10  and Rescue 1A, with conducting a search for Firefighter Mathews (E-26). The Engine 10 officer entered Floor 1 to conduct the search (alone) while instructing another of his firefighters to remain at the door. Rescue 1A followed Engine 26’s 1-1/2″ (38 mm) hoseline to Floor 1 Slide C. Rescue 1B relocated to Side B to search the basement for the missing firefighter.

The Engine 26 Officer again advised Command (Battalion 1) that Firefighter Mathews was missing. Engine 17 made a final request to attack the fire from Side C. Given that a firefighter was missing and believing that the fire had extended to Floor 1, Command instructed Engine 17 to attack the fire with a straight stream (to avoid pushing the fire onto crews working on Floor 1). At approximately 00:33, Battalion 2 reported (from Side C) that the fire was darkening down. Engine 14 arrived and staged on Bladensburg Road.

Command ordered a second alarm assignment at 00:34 hours. At 00:36, Command ordered Battalion 2 (on Side C) to have Engine 17 and Truck 4 search for Firefighter Mathews in the Basement. Engine 10’s officer heard a shrill sound from a personal alert safety system (PASS) and quickly located Firefighter Phillips (E-10). Firefighter Phillips was unconscious, lying on the floor (see Figure 4) with his facepiece and hood removed. Unable to remove Firefighter Phillips by himself, the officer from Engine 10 unsuccessfully attempted to contact Command (Battalion 1) and then returned to Side A to request assistance.

Command received a priority traffic message at 00:37, possibly attempting to report the location of a missing firefighter. However, the message was unreadable.

The Hazmat Unit and Engine 6 arrived and staged on Bladensburg Road and a short time later were tasked by Command to assist with rescue of the downed firefighter on Floor 1. Firefighter Phillips (E-10) was removed from the building by the Engine 10 officer, Rescue 1A, Engine 6, and the Hazardous Materials Unit at 00:45. After Firefighter Phillips was removed to Side A, Command discovered that Firefighter Mathews (E-26) was still missing and ordered the incident safety officer to conduct an accountability check. Safety attempted to conduct a personnel accountability report (PAR) by radio, but none of the companies acknowledged his transmission.

The Deputy Chief of the Firefighting Division arrived at 00:43 and assumed Command, establishing a fixed command post at the Engine 26 apparatus. Battalion 4 arrived a short time later and was assigned to assist with rescue operations along with Engines 4 and 14.

Firefighter Mathews was located simultaneously by several firefighters. He was unconscious leaning over a couch on Side C of the living room (see Figure 4). Firefighter Mathews breathing apparatus was operational, but he had not activated his (non-integrated) personal alert safety system (PASS). Firefighter Mathews was removed from the building by Engine 4, Engine 14, and Hazardous Materials Unit at 00:49.

Command (Deputy Chief) ordered Battalions 2 and 4 to conduct a face-to-face personnel accountability report on Sides A and C at 00:53.

Questions

  1. Based on the information provided in the case to this point, answer the following questions:
  2. National Institute for Occupational Safety and Health (NIOSH) Death in the Line of Duty Reports examining incidents involving extreme fire behavior often recommend close coordination of fire attack and ventilation.
  3. Did the fire behavior in this incident match the prediction you made after reading the previous post (Towhouse Fire: Washington DC-What Happened)?
  4. What type of extreme fire behavior occurred? Justify your answer?
  5. What event or action initiated the extreme fire behavior? Why do you believe that this is the case?
  6. How did building design and construction impact on fire behavior and tactical operations during this incident?
  7. How might a building pre-plan and/or 360o reconnaissance have impacted the outcome of this incident? Note that 360o reconnaissance does not necessarily mean one individual walking completely around the building, but requires communication and knowledge of conditions on all sides of the structure (e.g., two stories on Side A and three stories on Side C).
  8. How might the outcome of this incident have changed if Engine 17 had been in position and attacked the fire in the basement prior to Engines 26 and 10 committing to Floor 1?
  9. What strategies and tactics might have been used to mitigate the risk of extreme fire behavior during this incident?

More to Follow

This incident was one of the first instances where the National Institute of Standards and Technology (NIST) Fire Dynamics Simulator (FDS) was used in forensic fire scene reconstruction (Madrzykowski & Vettori, 2000). Modeling of the fire behavior in this incident helps illustrate what was likely to have happened in this incident. The next post in this series will examine and expand on the information provided by modeling of this incident.

Master Your Craft

Ed Hartin, MS, EFO, MIFireE, CFO

References

District of Columbia (DC) Fire & EMS. (2000). Report from the reconstruction committee: Fire at 3146 Cherry Road NE, Washington DC, May 30, 1999. Washington, DC: Author.

Madrzykowski, D. & Vettori, R. (2000). Simulation of the Dynamics of the Fire at 3146 Cherry Road NE Washington D.C., May 30, 1999, NISTR 6510. August 31, 2009 from http://fire.nist.gov/CDPUBS/NISTIR_6510/6510c.pdf

National Institute for Occupational Safety and Health (NIOSH). (1999). Death in the line of duty, Report 99-21. Retrieved August 31, 2009 from http://www.cdc.gov/niosh/fire/reports/face9921.html

The Ventilation Paradox

Monday, August 17th, 2009

I originally intended to write this post about the influence of air track on flashover in multiple compartments. However, after several conversations in the last week about the bathtub analogy and ventilation induced flashover, I had a change in plans.

The Bathtub Analogy

In Understanding Flashover: Myths and Misconceptions, I presented the bathtub analogy (Kennedy & Kennedy , 2003)as a simplified way of understanding how flashover occurs when a compartment fire is burning in a fuel controlled regime.

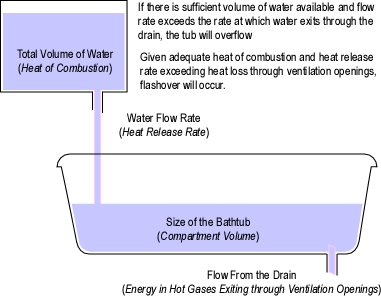
Flashover has been analogously compared to the filling of a bathtub with the drain open. In this practical, though not perfect, analogy water represents the heat energy. The quantity of water available is the total heat of combustion of the available fuels (fuel load). The size of the spigot and the water pressure control the amount of water flow that is the heat release rate. The volume of the bathtub is analogous to the volume of the compartment and its ability to contain the heat energy. The size and location of the bathtub drain controlling the rate of water loss is the loss of heat energy through venting and conductance. In this analogy, if the bathtub becomes full and overflows, flashover occurs. (Kennedy & Kennedy, 2003, p. 7)

Figure 1. The Bathtub Analogy-Fuel Controlled Burning Regime

bathtub_analogy

Note: Adapted from Flashover and fire analysis: A discussion of the practical use of flashover in fire investigation, p. 7, by Patrick Kennedy & Kathryn Kennedy, 2003. Sarasota, FL: Kennedy and Associates, Inc.

All Models are Wrong

While the bathtub model provides a simple explanation and makes it easy to understand how flashover might occur, it is inaccurate. However, as Box and Draper (1987) stated: “Essentially, all models are wrong, but some are useful” p. 424).

Models or analogies provide a way of understanding based on simplification. This is useful, but this simplification, while providing a starting point for understanding can overlook important concepts or elements of a complex system. In the case of the bathtub analogy, simplification overlooks the criticality of oxygen to the combustion process.

Ventilation is the exchange of the atmosphere inside a compartment with that which is outside. This process is necessary and ongoing in any space designed for human habitation. In a compartment fire, ventilation involves the exhaust of smoke and intake of air from outside the compartment.  Note that this is different than tactical ventilation, which is the planned and systematic removal of hot smoke and fire gases and their replacement with fresh air. However, both normal and tactical ventilation involve exhaust of the compartment atmosphere and replacement with fresh air.

While the bathtub analogy is simple, and provides a useful starting point, it fails to address the air side of the ventilation equation. As ventilation is increased, the compartment looses energy through convection. However, if the fire is ventilation controlled (heat release rate (HRR)is limited by the available oxygen), increased ventilation will also increase HRR.

Revised Bathtub Analogy

For many years, firefighters have been taught tactical ventilation prevents or slows progression to flashover. Somewhat less commonly, firefighters have been taught to close the door to the fire compartment, limiting inward air flow and slowing fire growth (tactical anti-ventilation). My friend and colleague Inspector John McDonough of the New South Wales (AU) Fire Brigades refers to this as the Ventilation Paradox. Increased ventilation increases the HRR required for flashover to occur and may prevent or slow progression to flashover or it may (and often does) result in flashover. Reduction in ventilation may prevent or slow progress to flashover, but also reduces the HRR required for flashover to occur and (less commonly) may result in flashover. It depends! Not the answer that firefighters want to hear.

Making the bathtub analogy a bit more complex may provide a starting point for understanding the ventilation paradox. At the root of this apparent paradox is the impact of ventilation on the thermodynamic system and the relationship between oxygen and release of energy from fuel (Thornton’s Rule). See Fuel and Ventilation [LINK) for more information on Thornton’s Rule and the relationship between oxygen, fuel, and energy.

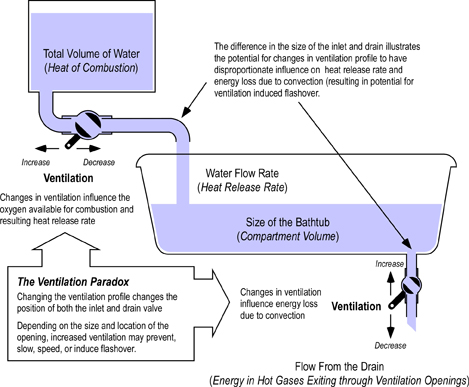
As illustrated in Figure 2, the revised bathtub analogy incorporates several changes. The inlet pipe has been enlarged (making it larger than the drain) and valves have been added to both the inlet and drain pipes. Most importantly, control of the valves is interconnected (but this is not shown visually as it makes the drawing even more complicated). Changing the position of either the inlet or drain, results in a corresponding change in the other valve.

Figure 2. Revised Bathtub Analogy-Ventilation Controlled Burning Regime

bathtub_analogy_rev

This analogy provides a reasonable (but still overly simplified and thus somewhat inaccurate) representation of a ventilation controlled compartment fire when normal building openings (e.g., doors, windows) serve as ventilation openings.

As illustrated in Figure 2, opening the drain also results in an increase in flow from the (larger) inlet, which without intervention is likely to result in the tub overflowing. In a compartment fire, increasing ventilation to a when the fire is burning in a ventilation controlled regime, increases convective heat loss, but HRR will also increase, potentially resulting in flashover.

Resolving the Paradox

Resolution of the problems presented by the paradox involve recognition of what burning regime the fire is in (fuel or ventilation controlled), understanding the influence of the location and size of ventilation openings on convective heat loss, understanding the influence of increased air intake on HRR, and coordination of ventilation and fire control tactics. On the surface, this all sounds quite simple, but is considerably more complex in practice.

Feedback

I would like to thank my friend and colleague Lieutenant Chris Baird, Gresham Fire & Emergency Services and my wife Sue for serving as my sounding board as I worked through the process of revising the bathtub analogy. As always your feedback and suggestions will be greatly appreciated.

Ed Hartin, MS, EFO, MIFireE, CFO

References

Box, G.& Draper, N. (1987). Empirical Model-Building and Response Surfaces, San Francisco: Wiley & Sons.

Kennedy, P. & Kennedy, K. (2003). Flashover and fire analysis: A discussion of the practical use of flashover in fire investigation. Retrieved July 30, 2009 from http://www.kennedy-fire.com/Flashover.pdf

Understanding Flashover:
Myths & Misconceptions Part 2

Thursday, August 6th, 2009

A Quick Review

The first post in this series, Understanding Flashover: Myths & Misconceptions provided a definition of flashover and examined this extreme fire behavior phenomenon in the context of fire development in a compartment.

Flashover is the sudden transition to fully developed fire. This phenomenon involves a rapid transition to a state of total surface involvement of all combustible material within the compartment….Flashover may occur as the fire develops in a compartment or additional air is provided to a ventilation-controlled fire (that has insufficient fuel in the gas phase and/or temperature to backdraft).

Burning Regime

In the incipient and early growth stages of a compartment fire, the speed of fire growth is fuel controlled as fire development substantially influenced by the chemical and physical characteristics of the fuel. However, oxygen is required for the fuel to burn and release thermal energy. As a compartment fire develops, the available air supply for combustion becomes a more important factor. Increased combustion requires more oxygen and as smoke fills the compartment while the lowering neutral plane at compartment openings restricts the introduction of air into the compartment (see Figure 1).

The neutral plane is the level at a compartment opening where the difference in pressure exerted by expansion and buoyancy of hot smoke flowing out of the opening and the inward pressure of cooler, ambient temperature air flowing in through the opening is equal (Karlsson & Quintiere, 2000).

Figure 1. Lowering Neutral Plane

lowering_np

Note: Photos adapted from National Institute of Standards and Technology (NIST) ISO-Room/Living Room Flashover.

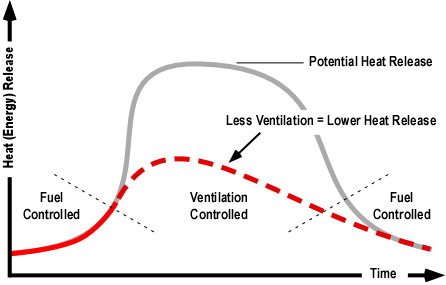
The distinction between fuel controlled and ventilation controlled is critical to understanding compartment fire behavior. Compartment fires are generally fuel controlled while in the incipient and early growth stage and again as the fire decays and the demand for oxygen is reduced (see Figure 2).

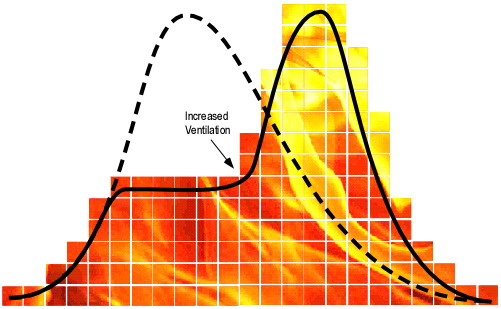
Figure 3. Fire Development with Limited Ventilation

ventilation_controlled_curve

While a fire is fuel controlled, the rate of heat release and speed of development is limited by fuel characteristics as air within the compartment and the existing ventilation profile provide sufficient oxygen for fire development. However, as the fire grows the demand for oxygen increases, and at some point (based on the vent profile) will exceed what is available. At this point the fire transitions to ventilation control. As illustrated in Figure 1, a ventilation controlled fire may reach flashover, all that is necessary is that sufficient oxygen be available for the fire to achieve a sufficient heat release rate for flashover to occur.

Heat Release and Oxygen

Combustion, as an oxidation reaction requires sufficient oxygen to react with the available fuel. Heat of combustion (energy released) and oxygen required for complete combustion are directly related (Thornton, 1917).The energy released per gram of oxygen consumed during complete combustion of natural and synthetic organic fuels is fairly consistent, averaging 13.1 kJ/g (±0.5%) (Huggett, 1980).

Release of chemical potential energy from fuel is dependent on availability of adequate oxygen for the combustion reaction to occur. Interestingly, while the heat of combustion of various types of organic (carbon based) fuel varies widely, the amount of oxygen required for release of a given amount of energy remains remarkably consistent.

In the early 1900s, British scientist W.M. Thornton (1917) discovered that the amount of oxygen required per unit of energy released from many common hydrocarbons and hydrocarbon derivatives is fairly constant. In the 1970’s, researchers at the National Bureau of Standards independently discovered the same thing and extended this work to include many other types of organic materials and examined both complete and incomplete combustion (Huggett, 1980; Parker, 1977).

Each kilogram of oxygen used in the combustion of common organic materials results in release of 13.1 MJ of energy. This is referred to as Thornton’s Rule. See Fuel and Ventilation for a more detailed discussion of the application of Thornton’s Rule to compartment fires and ventilation.

Failure to Reach Flashover

Ventilation controlled compartment fires may reach flashover and fully developed compartment fires are generally ventilation controlled (IAAI, 2009). However, lack of ventilation may prevent a compartment fire from generating sufficient heat release rate to reach flashover. In some cases, ventilation controlled fires to not become fully developed, but decay and self-extinguish due to lack of oxygen.

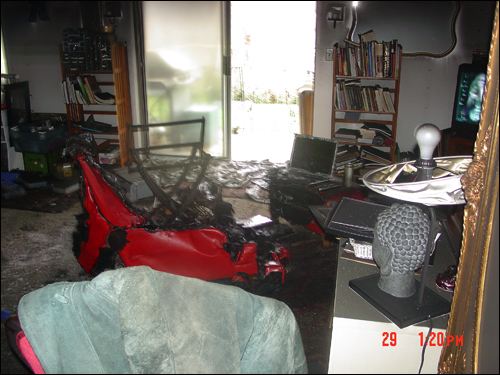
In late 2007 an engine and truck company responded to a report of an odor of smoke in a three-story, wood-frame, apartment building. They discovered a ground floor apartment was smoke logged. They requested a first alarm assignment, forced entry, and initiated fire attack and primary search. Smoke was cool and to the floor, the fire was confined to an upholstered chair and miscellaneous items in the living room and at the time of entry was simply smoldering (see Figure 3). A rapid search discovered a deceased occupant in a bedroom remote from the fire.

Figure 3. Self-Extinguished Compartment Fire

walula_1

Note: Gresham Fire & Emergency Services Photo

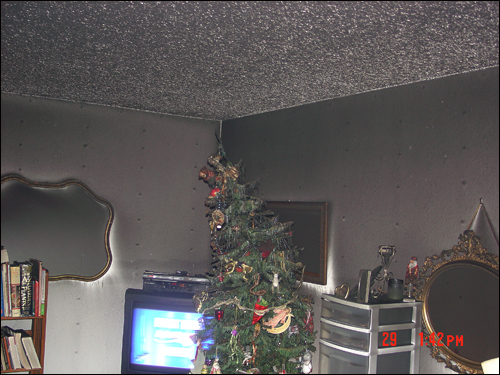
While a fire involving an upholstered chair typically results in sufficient heat release rate for the fire to extend to other nearby fuel packages and ultimately reach flashover, this fire did not as evidenced by the condition of the Christmas tree on the opposite side of the living room from the point of origin (see Figure 4). The Christmas tree, like many other fuel packages in the apartment showed evidence of pyrolysis, but did not ignite.

Figure 4. Condition of Other Fuel Packages

walula_2

Note: Gresham Fire & Emergency Services Photo

Why didn’t this fire reach flashover? The fire occurred in early winter and the apartment’s energy efficient windows and doors were tightly closed. The developing fire consumed the oxygen available within the apartment and absent significant ventilation, decayed, and the temperature inside the apartment which had been increasing as the fire developed, dropped to a temperature slightly higher than would normally be expected inside an occupied apartment.

How might the development of this fire been different if it had been discovered earlier? What if a neighbor had opened a door or window in an effort to rescue the occupant? What if the fire department had opened the door without recognizing that the fire was significantly ventilation controlled?

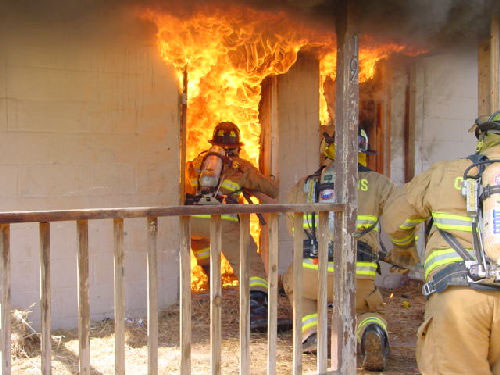
When fire development is limited by the ventilation profile of the compartment, changes in ventilation will directly influence fire behavior. Reducing ventilation (i.e. by closing a door) will reduce the rate of heat release and slow fire development. Increasing ventilation (i.e. by opening a door or window) will increase the rate of heat release and speed fire development. Changes in ventilation profile may be fire caused (failure of glass in a window), occupants (leaving a door open), or tactical action by firefighters; but all will have an influence on fire behavior!

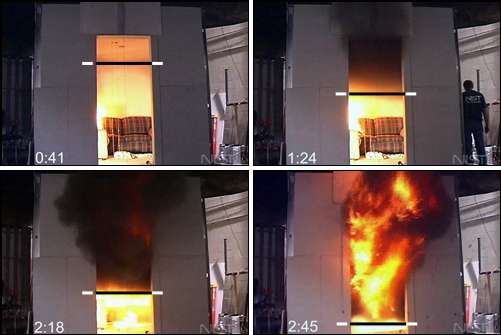
Figure 5. Ventilation Induced Flashover

vent_induced_flashover

For many years firefighters have been taught that ventilation reduces the potential for flashover. While this is sometimes true, it is only part of the story. Increasing ventilation to a fuel controlled fire will allow hot gases to exit, transferring thermal energy out of the compartment and replacing the hot gases with cooler air (which increases heat release rate). The combined influence of these two factors slows progression towards flashover and increases the heat release rate required to reach flashover. The bathtub analogy presented in Understanding Flashover: Myths and Misconceptions [LINK], does not apply in this case, because when a fire is ventilation controlled, heat release rate is limited by the available oxygen. Under ventilation controlled conditions; increasing air supply by creating opening results in increased heat release rate. This increased heat release rate may result in flashover (see Figure 5). For more information see Hazards of Ventilation Controlled Fires.

Two Paths to Flashover

With adequate fuel and oxygen, a growth stage compartment fire may flashover and rapidly transition to the fully developed stage. Given adequate fuel, but lacking adequate oxygen (due to limited ventilation), a growth stage compartment fire may begin to decay before becoming fully developed. However, this can quickly change if ventilation is increased, potentially resulting in ventilation induced flashover.

Understanding these two paths to flashover is essential, but still does not provide a complete picture of the flashover phenomena. The next post in this series will will use several case studies to examine the influence of air track on flashover in multiple compartments the threat that rapid fire progression presents to firefighters.

Ed Hartin, MS, EFO, MIFIreE, CFO

References

Karlsson, B. & Quintiere, J. (2000). Enclosure fire dynamics. New York: CRC Press.

National Institute of Standards and Technology. (2005). ISO-room/living room flashover [digital video disk]. Gaithersburg, MD: Author.

Thornton, W. (1917). The relation of oxygen to the heat of combustion of organic compounds. The Philosophical Magazine,33(6), 196-203.

Parker, W. (1977). An investigation of the Fire Environment in the ASTM E 84 Tunnel Test, NBS Technical Note945. Gaithersburg, MD: U.S. Department of Commerce/National Bureau of Standards.

International Association of Arson Investigators (IAAI). (2009). Post flashover fires. On-Line Training Program, Downloaded August 6, 2009 from http://www.cfitrainer.net.

Understanding Flashover:
Myths and Misconceptions

Thursday, July 30th, 2009

Flashover is likely the most common type of extreme fire behavior encountered in structural firefighting. As my friends and colleagues from Sweden frequently observe, this is not really extreme fire behavior, its normal fire behavior. I think it is both. The term extreme “is framed within the context of our perception with ‘extreme’ defining our limited ability to control it and its potential impact on firefighter safety” (Close, 2005). However, occurrence of flashover is not abnormal or random; it is a simple matter of the chemistry and physics involved in a compartment fire.

Misconceptions

For some time, I have been collecting comments and statements related to extreme fire behavior phenomena in the press, fire service publications, and training materials. While it is quite possible to find accurate information on the phenomena of flashover, misconceptions and erroneous information are also common.

  • There may have been a flashover at the home when gas in the air ignited
  • Firefighters who responded to the blaze nearly got caught inside when an explosion or dangerous condition called a “flashover” occurred
  • A flashover occurs when the air temperature reaches between 900 and 1,000, which is hot enough to ignite any gases that are in the air… The result is potentially deadly explosive conditions
  • It’s what we call a flashover, were you have a combustible gas or even dust in the area and then all of a sudden, almost explosive-like, that vapour cloud will ignite
  • Firefighters were caught in a rare “flashover,” an instance in which superheated gases and combustible materials simultaneously ignite
  • When the room bursts into flame, flashover has occurred

Each of the preceding statements was made (or at least reported to have been made) by experienced fire officers. Failure to recognize and mitigate conditions that may result in flashover during firefighting operations results in significant risk to firefighters. At the core of recognition and mitigation is understanding what flashover is, what causes it, and the conditions necessary for it to occur.

What is Flashover?

Flashover is the sudden transition to fully developed fire. This phenomenon involves a rapid transition to a state of total surface involvement of all combustible material within the compartment. If flashover occurs, the rate of heat release in the compartment as well as the temperature in the compartment increases rapidly. Flashover may occur as the fire develops in a compartment or additional air is provided to a ventilation-controlled fire (that has insufficient fuel in the gas phase and/or temperature to backdraft).

Indicators of flashover include a radiant heat flux at the floor of 15-20 kW/m2 (radiant heat transfer sufficient to quickly raise ordinary combustibles to their ignition temperature) and average upper layer temperature of 500o-600o C (932o-1112o F) (Drysdale, 1998). More observable indicators include rapid flame spread and extension of flames out of compartment openings. Compartment windows may also fail due to rapid temperature increases on the inner surface of window glazing (Gorbett & Hopkins (2007).

Figure 1.Flashover

flashover_figure1

Note: Photo by William Cobb, Cornelius – Lemley Fire Rescue

Flashover and Fire Development

There are a number of definitions or ways to describe flashover, but most importantly, it is a rapid transition to a fully developed fire.

A fuel package such as a couch or upholstered chair burning in open air progresses through four phases. In the incipient stage the fire involves only a small amount of fuel, as the fire moves into the growth stage, more fuel becomes involved and the speed of the combustion reaction increases. Eventually the entire object becomes involved and the fire is fully developed. As the fuel is consumed the fire begins to decay. Throughout this process, fire development is fuel controlled; the speed of fire development and energy released is dependent on the characteristics and configuration of the fuel. As combustion is taking place in the open, there is adequate oxygen to support combustion as the fire progresses through each of the four stages.

Heat of combustion is the energy released when a specific mass of fuel is completely burned. The total energy released when an object burns is dependent on the heat of combustion and the amount (mass) of fuel burned. Heat of combustion is measured in Joules (J). However, this only provides part of the picture. Heat release rate (HRR) is the amount energy released per unit of time. HRR is measured in Watts (W). A Watt is a Joule (unit of energy) per second (unit of time).  The fire service in the United States has traditionally used the British thermal unit (Btu) as a unit of energy. Using this unit of measure, HRR could be expressed in Btu/s. All of this is very interesting, but what does this have to do with flashover? As it turns out, heat release rate has everything to do with flashover!

When a fire is unconfined, much of the heat produced by the burning fuel escapes through radiation and convection. What changes when the fire occurs in a compartment? Fire development becomes influenced by the characteristics of the compartment. Other materials in the compartment as well as the walls, ceiling and floor absorb some of the energy released by the fire.  Some of the energy is not absorbed, but radiates back to the burning fuel continuing and accelerating the combustion process.

Hot smoke and air heated by the fire become more buoyant and rise, on contact with cooler materials such as the ceiling and walls of the compartment; heat is transferred to the cooler materials, raising their temperature. This heat transfer process raises the temperature of all materials in the compartment. As nearby fuel is heated, it begins to pyrolize. Eventually the rate of pyrolysis may reach a point where flaming combustion can be supported and the fire extends to other fuel packages.

However, the most significant difference with fire in a compartment is the compartment’s ventilation profile. The size, location, and configuration of openings in the compartment influence both the oxygen available for combustion and the retention or escape of thermal energy contained in the hot gases and smoke produced by the fire.

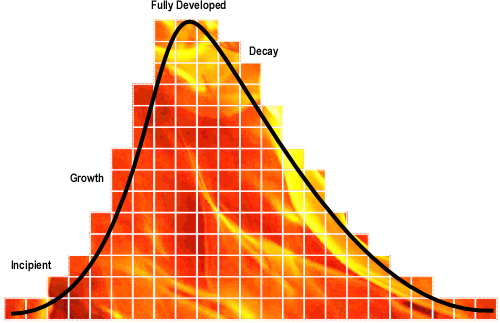
While the “stages of fire” have been described differently in fire service textbooks the phenomenon of fire development is the same. For our purposes, the stages of fire development in a compartment will be described as incipient, growth, fully developed and decay (see Figure 2). Despite dividing fire development into four “stages” the actual process is continuous with “stages” flowing from one to the next. While it may be possible to clearly define these transitions in the laboratory, in the field it is often difficult to tell when one ends and the next begins.

Figure 2. Stages of Fire Development

fire_development_stages

If the fire releases energy faster than it can escape from the compartment, temperature will increase and if sufficient energy is released, flashover will occur and the fire will transition rapidly from the growth to fully developed stage (see Figure 2). As this occurs, the fire will spread across all combustible surfaces in the compartment and flames will exit through compartment openings.

The bathtub analogy (see Figure 3) provides a simple way to explain the relationship between ventilation and flashover in a fuel controlled compartment fire.

Flashover has been analogously compared to the filling of a bathtub with the drain open. In this practical, though not perfect, analogy water represents the heat energy. The quantity of water available is the total heat of combustion of the available fuels (fuel load). The size of the spigot and the water pressure control the amount of water flow that is the heat release rate. The volume of the bathtub is analogous to the volume of the compartment and its ability to contain the heat energy. The size and location of the bathtub drain controlling the rate of water loss is the loss of heat energy through venting and conductance. In this analogy, if the bathtub becomes full and overflows, flashover occurs. (Kennedy & Kennedy, 2003, p. 7)

Figure 3. The Bathtub Analogy

bathtub_analogy

More to Follow

Posts over the next few weeks will continue to examine the process of reading the fire with further exploration of air track, heat, and flame indicators. In addition, I will be continuing this look at the flashover phenomena with a particular emphasis on the relationship between heat release rate, ventilation, and flashover.

Ed Hartin, MS, EFO, MIFireE, CFO

References

Close, K. (2005) Fire behavior vs. human behavior: Why the lessons from Cramer matter. Paper presented at the Eighth International Wildland Fir e Safety Summit, Missoula,MT. Retrieved May 13, 2008 from http://www.myfirecommunity.net/documents/Close.pdf

Drysdale, D. (1998). An introduction to fire dynamics. New York: John Wiley & Sons.

Gorbet, G & Hopkins, R. (2007) The current knowledge & training regarding backdraft, flashover, and other rapid fire progression phenomena. Paper presented at the annual meeting of the National Fire Protection Association, Boston, MA.

Kennedy, P. & Kennedy, K. (2003). Flashover and fire analysis: A discussion of the practical use of flashover in fire investigation. Retrieved July 30, 2009 from http://www.kennedy-fire.com/Flashover.pdf

Contra Costa County LODD: What Happened?

Thursday, May 14th, 2009

My last two posts (Contra Costa County Line of Duty Deaths (LODD) Part 1 & Part 2) examined the conditions and circumstances involved in the incident that took the lives of Captain Matthew Burton and Engineer Scott Desmond while conducting primary search in a small residential structure in San Pablo, California early on the morning of July 21, 2007.

As identified in the Contra Costa County Investigation and NIOSH Death in the Line of Duty Report F2007-28, these line of duty deaths were the result of a complex web of events, circumstances, and actions.

These two reports identify the rapid fire progression that trapped Captain Burton and Engineer Desmond as a fire gas ignition (county and NIOSH reports) or ventilation induced flashover (NIOSH report). Both reports also point to ineffective or inappropriate use of positive pressure ventilation as a contributing factor in the occurrence of extreme fire behavior. However, neither report provides a substantive explanation of how and why this extreme fire behavior occurred.

Investigative Approach

Developing a reasonable explanation of the extreme fire behavior that occurred in this incident involved application of the scientific method as outlined in NFPA 921 Standard on Fire and Explosion Investigations (2008).

The following analysis is based on narrative data and photographic evidence provided in the Contra Costa County Fire Protection District Investigation Report: Michele Drive Line of Duty Deaths and the video taken by the Q76 Firefighter.

In that the district and NIOSH had already collected data, this effort focused on 1) analysis of the data contained in the incident reports, photographs, and video; 2) development of a hypothesis that provided an explanation for what occurred (deductive reasoning), 3) testing this hypothesis (inductive reasoning); 4) revising the hypothesis as necessary; and 5) selecting a final hypothesis.

Figure 1. Fire Development in Bedroom 2

fire_scenario_1_sr

Hypothesis

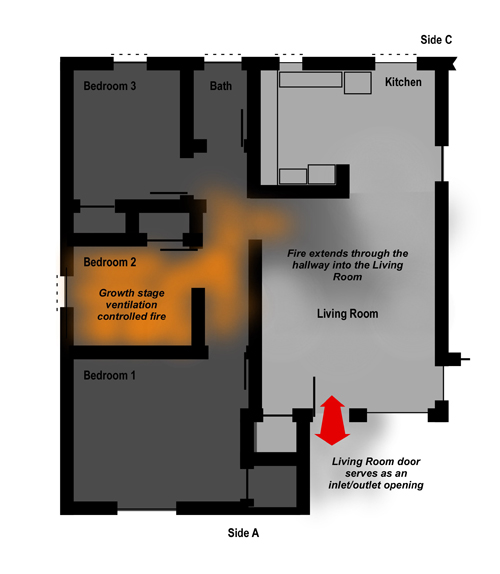
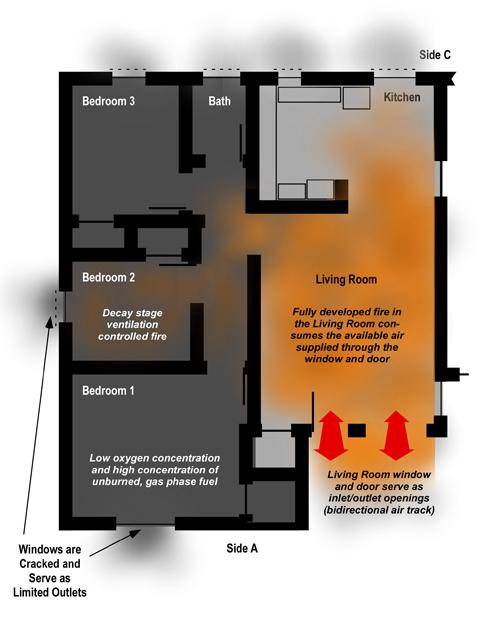
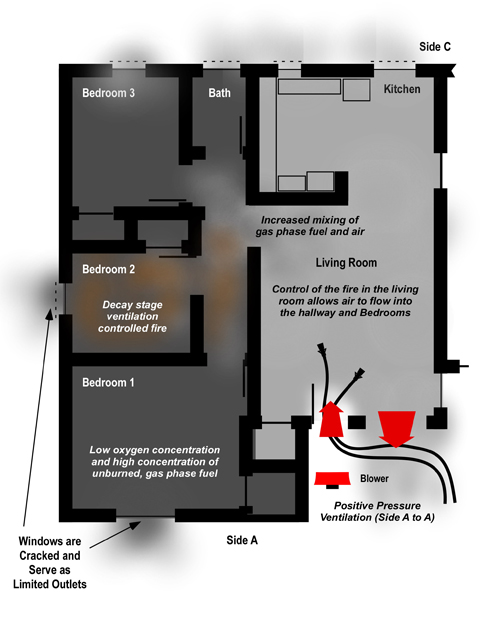
The fire originated in Bedroom 2, likely on or near the bed. In the growth stage, the fire extended through the hallway into the living room (see Figure 1). The fuel load in the living room and ventilation provided by the open front door permitted the fire to progress through flashover and become fully developed (see Figure 2).

Figure 2. Extension and Fire Development in the Living Room

fire_scenario_2_sr

The extent of fire in the living room consumed the oxygen supplied through the front door, resulting in an extremely ventilation controlled fire in the hallway and bedroom. Unburned flammable products of combustion and pyrolysis products from contents and structural materials accumulated in the upper layer in the bedrooms and hallway.

Figure 3. Fire Control and Development of a Gravity Current

fire_scenario_3_sr

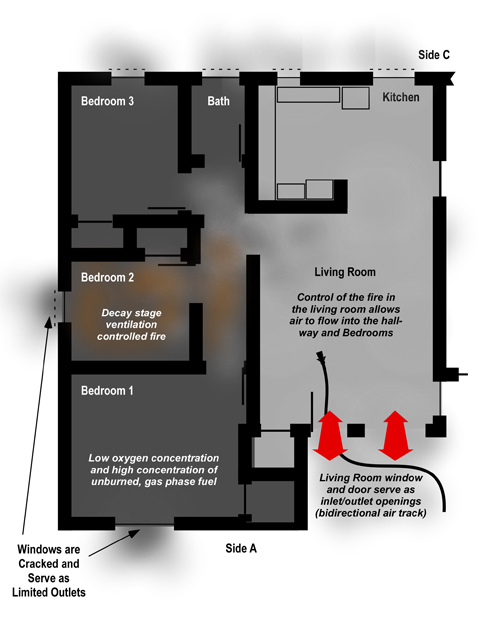
Extinguishment of the fire in the living room allowed development of a gravity current and movement of oxygen through the living room to the hallway and bedrooms allowing flaming combustion in these areas to resume.

Figure 4. Positive Pressure Ventilation

fire_scenario_4_sr

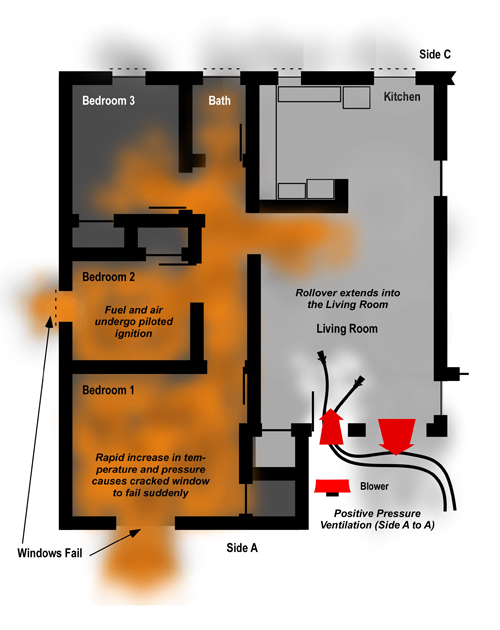
Flaming combustion in the hallway or bedroom resulted in piloted ignition of a substantive accumulation of pyrolysis products and flammable products of incomplete combustion in the upper layer within the hallway and bedrooms. Application of positive pressure at the door on Side A influenced (or speeded up) this phenomena and may have increased the violence of this ignition (due to increased pressure and confinement) but likely aided in limiting the spread of flaming combustion from the hallway into the living room.

Figure 5. Fire Gas Ignition

fire_scenario_5_sr

Supporting Information

Information supporting the preceding hypothesis is divided into three categories: Known, suspected, and assumptions.

Known

The cause and origin  and line of duty death investigation conducted by the Contra Costa Fire Protection District and line of duty death investigation conducted by NIOSH identified and documented a range of data supporting this hypothesis. These data elements include physical evidence, and narrative data obtained from interviews with individuals involved in the incident.

  • The fuel load in the bedroom included a bed, dresser, and other contents, exposed wood ceiling, carpet, and carpet pad.
  • Fire originated in Bedroom 2 (on or near the bed)
  • The female occupant exited the structure prior to making a 911 call to report the fire (via cell phone).
  • The female occupant then reentered the building prior to the arrival of the first fire unit in an effort to rescue her husband. [Observations by bystanders included in the report]
  • The fire in Bedroom 2 entered the growth stage and extended into the hallway and subsequently the living room. This fire spread was in part due to the combustible wood ceiling. [Information on the cause and origin investigation provided in the report]
  • Windows other than the living room window on Side A were substantively intact until the occurrence of the extreme fire behavior event. [Observation by firefighters included in the report]
  • E70 knocked down the fire in the living room prior to initiating primary search (without a hoseline). E70 used a left hand search pattern in which they would have moved into the hallway and bedrooms located on Side B of the residence.
  • A blower was placed at the front door while E70 and E73 were conducting primary search. Due to the placement of the blower close to the door, it is possible that the air cone did not fully cover the door opening. There is no mention in the report regarding the air track at the door or living room window following placement of the blower. However, E73 reported increased visibility and temperature in the kitchen a short time after the blower was placed, and observed rollover from the hallway leading to the bedrooms.]
  • The large window in the living room (if fully cleared of glass) would provide approximately equal area as the door on Side A used as an inlet. Given an equal sized inlet and outlet, efficiency of PPV is likely to be approximately 70%. However, given the location of the exhaust opening next to the inlet, the effectiveness of this ventilation at clearing smoke from compartments beyond the living room and kitchen would have been limited.
  • Vertical ventilation was not completed until after the occurrence of the extreme fire behavior phenomena that trapped and killed Captain Burton and Engineer Desmond. The exhaust opening created in the roof had limited impact on interior conditions when it was completed due to the presence of the original roof.
  • Fuel load in this compartment was more than sufficient to provide the heat release rate necessary to allow fire development to flashover. [This assessment is based on post-fire photos, room dimensions, and ventilation openings at the time of the ignition].
  • Other bedrooms contained a similar fuel load.

Deductions

Several factors supporting the stated hypothesis are not directly supported by physical evidence or narrative data. These elements are deduced based on the design, construction, and configuration of the building and principles of fire dynamics in conjunction with known information.

  • The front door remained open after the female occupant reentered. [E70 reported fire and smoke showing from the door and living room window on arrival, but no information provided in the report regarding the position of the door or extent to which the window had failed (fully or partially)]
  • Use of the blower is likely to have increased mixing of air and hot, fuel rich fire gases in the hallway, particularly near the opening between the hallway and the living room. Ventilation of smoke from the living room and kitchen through the window on Side A, likely reduced the potential for flaming combustion to have extended from the hallway into the living room.
  • Heat conducted through the tongue and groove wood roof/ceiling may have resulted in melting and gasification of asphalt roofing which may have been forced through gaps between the planks to add to the gas phase fuel resulting from pyrolysis and incomplete combustion of contents and structural surfaces within the involved compartments.
  • The primary source of air for the fire was through the front door and the living room window. The bottom of the doorway was the lowest opening in the building, likely resulting in a bi-directional air track with smoke exiting out the top of the door and air entering at the bottom. While the sill of the living room window was higher than the door, a bi-directional air track likely developed at this opening as well, with the extreme lower portion of the window opening serving as an inlet while the top of the window functioned as an outlet for flames and smoke [No information about air track at the front door was provided in the report.]
  • The fire in the living room reached the fully developed stage after the civilian occupant reentered and prior to the arrival of E70 [This deduction is based on the ability of the female occupant to enter and make her way to the kitchen and the presence of flames exiting the door and living room window on Side A when E70 arrived]

Assumptions

In addition to known and deduced information, the hypothesis is based on the following assumptions.

  • The fully developed, ventilation controlled fire in the living room substantively utilized the atmospheric oxygen provided by the air entering through the front door, causing the fire in Bedroom 2 and the hallway to enter ventilation controlled decay. The decay stage fire and heat from the hot gas layer present in the hallway and adjacent rooms continued pyrolysis of fuel packages in this area, resulting in accumulation of a substantial concentration of gas phase fuel in the smoke.
  • Control of the fully developed fire in the living room reduced oxygen demand from the fire. The bi-directional air track would have continued and gravity current would have increased air supply to the ventilation controlled decay stage fire in the hallway and bedroom(s).
  • Establishment of positive pressure ventilation with the door on Side A serving as the inlet (or inlet and outlet) and the living room window serving as an outlet would have cleared smoke from the living room, but would not have influenced smoke movement from the hallway and bedrooms (as quickly).

Validation

Special thanks to Dr. Stefan Svensson of the Swedish Civil Contingencies Agency and Assistant Professor Greg Gorbett of Eastern Kentucky University for serving as critical friends and providing useful feedback in development of this analysis.

This hypothesis is supported by a range of evidence, deductions and assumptions. However, further validation would require use of other methods such as development of a computational fluid dynamics model and small or full scale fire tests.

More to Follow

My next post will examine the potential influence of positive pressure ventilation (PPV) in this incident as well as a broader look at potential hazards when PPV is used incorrectly or under inappropriate circumstances.

Master Your Craft

Ed Hartin, MS, EFO, MIFireE, CFO

References

Contra Costa County Fire Protection District.  (2008). Investigation report: Michele drive line of duty deaths. Retrieved February 13, 2009 from http://www.cccfpd.org/press/documents/MICHELE%20LODD%20REPORT%207.17.08.pdf

National Institute for Occupational Safety and Health (2009).  Death in the line of duty report 2007-28. Retrieved May 5, 2009 from http://www.cdc.gov/niosh/fire/pdfs/face200728.pdf.

National Fire Protection Association (NFPA) (2008) NFPA 821 Standard on fire and Explosion Investigations. Quincy, MA: Author.

NIST Wind Driven Fire Experiments:
Wind Control Devices & Fire Suppression

Thursday, March 12th, 2009

Continuing examination of NIST’s research on Firefighting Tactics Under Wind Driven Conditions, this post looks at the results of experiments involving use of wind control devices and external water application.

In my last post, I posed several questions about wind control devices to “prime the pump” regarding wind driven fires and potential applications for use of wind control devices.

Questions

Give some thought to how wind can influence compartment fire behavior and how a wind control device might mitigate that influence.

  • How would a strong wind applied to an opening (such as the bedroom window in the NIST tests) influence fire behavior in the compartment of origin and other compartments in the structure?
  • How would deployment of a wind control device influence fire behavior?
  • While the wind control device illustrated in Figure 5 was developed for use in high-rise buildings, what applications can you envision in a low-rise structure?
  • What other anti-ventilation tactics could be used to deal with wind driven fires in the low-rise environment?

Answers: Thornton’s Rule indicates that the amount of oxygen required per unit of energy released from many common hydrocarbons and hydrocarbon derivatives is fairly constant. Each kilogram of oxygen used in the combustion of common organic materials results in release of 13.1 MJ of energy. Fully developed compartment fires are generally ventilation controlled (potential heat release rate (HRR) based on fuel load exceeds the actual HRR given the atmospheric oxygen available through existing ventilation openings). Application of wind can dramatically increase heat release rate by increasing the mass of oxygen available for combustion. In addition to increasing HRR, wind can significantly increase the velocity of hot fire gases and flames (and resulting convective and radiant heat transfer) between the inlet and outlet openings.

Deployment of a wind control device to cover an inlet opening (window or door), limits oxygen available for combustion to the air already in the structure and normal building leakage. In addition, blocking the wind will also reduce gas and flame velocity between the inlet and outlet.

While wind driven fires are problematic in high-rise buildings, the same problem can be encountered in low-rise structures and wind control devices may prove useful in some circumstances. However, exterior attack (discussed later in this post) is more feasible than in a high-rise building and other tactics such as door control may also prove essential in managing hazards presented by wind.

Test Conditions

As outlined in my earlier post, Wind Driven Fires, NIST conducted a number of different wind driven tests using the same multi-compartment structure. Experiment 3 involved evaluation of anti-ventilation tactics using a large wind control device placed over the bedroom window. Wind conditions of 6.7 m/s to 8.9 m/s (15 mph-20 mph) were maintained throughout the test.

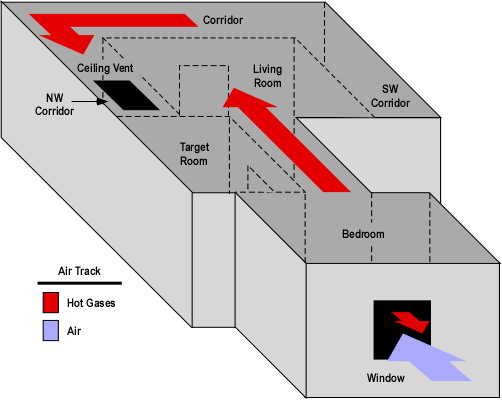
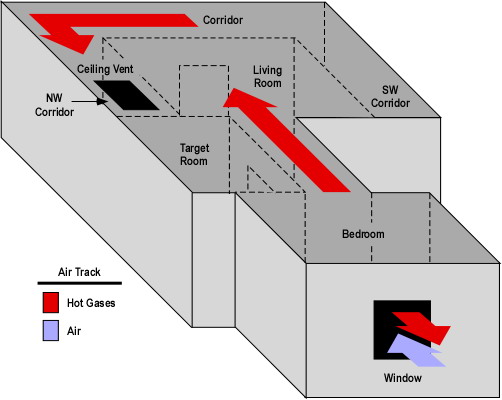
As with the baseline test, two ventilation openings were provided. A ceiling vent in the Northwest Corridor and a window (fitted with glass) in the bedroom (compartment of origin). During the test the window failed due to fire effects and was subsequently fully cleared by the researchers to provide a full window opening for ventilation.

Figure 1. Isometric Illustration of the Test Structure

test_floor_plan_wind

Note: The location of fuel packages in the bedroom and living room is shown on the Floor Plan provided in Wind Driven Fires post.

Experiment 3 Wind Driven Fire

This experiment was one of several that investigated wind driven fire behavior and the effectiveness of a wind control device deployed over the bedroom window to limit inward airflow. The fire was ignited in the bedroom and allowed to develop from incipient to fully developed stage in the bedroom.

The fire progressed in a similar manner as observed in the baseline test described in my earlier post NIST Wind Driven Fire Experiments: Establishing a Baseline. In this experiment the fire involving the initial fuel packages (bed and waste container) and visible smoke layer developed slightly more slowly. However, the bedroom window failed more completely and 11 seconds earlier than in the baseline test.

Almost immediately after the window failed, turbulent flaming combustion filled the bedroom and hot gases completely filled the door between the living room and corridor and were impinging on the opposite wall. At 222 seconds (15 seconds after the window was completely cleared) flames were visible in the corridor and the hollow core wood door in the target room was failing with flames breaching the top corners of the door and a smoke layer developing in the target room. While most of the hot gases and flames were driven through the interior (towards the ceiling vent in the corridor), flames continued to flow out the top of the window opening (against the wind).

At 266 seconds conditions had further deteriorated in all compartments with no visibility in the corridor and increased deterioration of the door to the target room. At this point the air track at the window was completely inward (no flames outside the window).

The wind control device was deployed at 270 seconds. Unfortunately soot on the video cameras lenses precluded a good view of interior conditions. However, video from the thermal imaging camera no longer showed any flow of hot gases into the corridor (only high temperature).

At 330 seconds, shortly after removal of the wind control device flames were visible in the bedroom and the fire quickly progressed to a fully developed state. At 360 seconds, flames were pulsing out the window opening (against the wind).

The experiment was ended at 380 seconds and the fire was extinguished.

Heat Release Rate

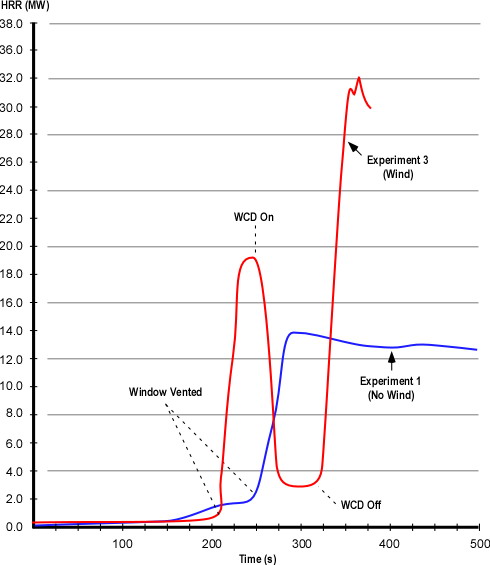
As with the baseline test NIST researchers recorded heat release rate data during Experiment 3. As discussed earlier in this post, application of wind increased the amount of oxygen available for combustion and resulting heat release rate in comparison to the baseline test.

Figure 2. Heat Release Rates in Experiments 1 (Baseline) and 3 (Wind Driven)

hrr_experiment3

Note: Adapted from Firefighting Tactics Under Wind Driven Conditions.

Questions: Examine the heat release rate curves in Figure 2 and answer the following questions:

  • What effect did deployment of the wind control device have on HRR and why did this change occur so quickly?
  • How did HRR change when the wind control device was removed and why was this change different from when the window was vented?
  • What factors might influence the extent to which HRR changes when ventilation is increased to a compartment fire in a ventilation controlled burning regime?

Wind Control Device Research and Application

NIST has continued research into the practical application of wind control devices with tests in Chicago and New York involving large apartment buildings and realistic fuel loading. For additional information on these tests and video of wind control device deployment, visit the NIST Wind Driven Fires webpage.

Fire Control Experiments

NIST researchers also conducted a series of experiments in the same structure examining the impact of various fire control tactics. These included application of water using solid stream and combination nozzles (using a 30o fog pattern with continuous application). In addition, they examined the influence of coordinated deployment of a wind control device and low flow water application of water fog). In each of these tests, water was applied from the exterior of the structure through the bedroom window.

Water Fog Application: Experiment 6 involved application of water using a hoseline equipped with a combination nozzle at 90 psi (621 kPa) nozzle pressure, providing a flow rate of 80 gpm (303 lpm). The fog stream was initially applied across the window (no discharge into the bedroom). This had a limited effect on conditions on the interior. When applied into the room, the 30o fog pattern was positioned to almost completely fill the window. This action resulted in a brief increase (approximately 4 MW) and then a dramatic reduction in HRR.

Solid Stream Application: Experiments 7 and 8 involved application of water using a hoseline equipped with a 15/16″ smooth bore nozzle at 50 psi (345 kPa) nozzle pressure, providing a flow rate of 160 gpm (606 lpm).  The solid stream was initially directed at the ceiling and then in a sweeping motion across the ceiling. In Experiment 8, the stream was then directed at burning contents in the compartment. Application of the solid stream had a pronounced effect, dramatically reducing heat release rate in both experiments.

Conditions varied considerably between these three tests (Experiments 6-8). This makes direct comparison of the results somewhat difficult. However, several conclusions can be drawn from the data:

  • Exterior application of water can be effective in reducing HRR in wind driven fires.
  • Both solid stream and fog application can be effective in reducing HRR under these conditions.
  • Continuous application of water fog positioned to nearly fill the inlet opening develops substantial air flow which can increase HRR (this works similar to the process of hydraulic ventilation, but in reverse).
  • A high flow solid stream may be more effective (but not necessarily more efficient) than a lower flow fog pattern if a direct attack on burning contents can be made.

Coordinated WCD Deployment and Water Application: Experiments 4 and 5 involved evaluations of anti-ventilation and water application using a small wind control device and 30 gpm (113.6 lpm) spray nozzle from under the wind control device. The effectiveness of the wind control device was similar to other anti-ventilation tests and application of low flow water fog resulted in continued decrease in HRR throughout the experiment.

Ed Hartin, MS, EFO, MIFireE, CFO

References

Madrzykowski, D. & Kerber, S. (2009). Fire Fighting Tactics Under Wind Driven Conditions. Retrieved (in four parts) February 28, 2009 from http://www.nfpa.org/assets/files//PDF/Research/Wind_Driven_Report_Part1.pdf; http://www.nfpa.org/assets/files//PDF/Research/Wind_Driven_Report_Part2.pdf;http://www.nfpa.org/assets/files//PDF/Research/Wind_Driven_Report_Part3.pdf;http://www.nfpa.org/assets/files//PDF/Research/Wind_Driven_Report_Part4.pdf.

NIST Wind Driven Fire Experiments:
Establishing a Baseline

Thursday, March 5th, 2009

My last post introduced a National Institute for Standards and Technology research project examining firefighting tactics for wind driven structure fires (particularly those occurring in high-rise buildings). The report on this research Firefighting Tactics Under Wind Driven Conditions contains a tremendous amount of information on this series of experiments including heat release rate, heat flux, pressure, velocity, and gas concentrations during each of the tests along with time sequenced still images (video and infrared video capture).

This post will examine the initial test used to establish baseline conditions for evaluation of wind driven fire conditions and tactics. Readers are encouraged to download a copy of the report and dig a bit deeper!

Test Conditions

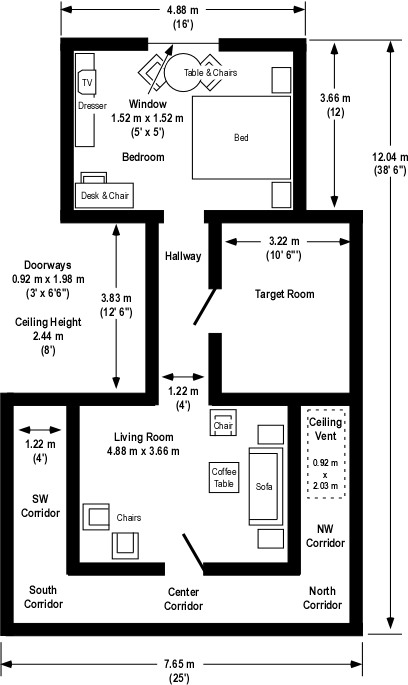
In Wind Driven Fires, I provided an overview of the multi-compartment test structure and fuel load used for this series of experiments. To quickly review, the test structure was comprised of three compartments; Bedroom, Target Room (used to assess tenability in a compartment adjacent to the ventilation flow), and Living Room, along with an interconnecting hallway (between the Bedroom and Living Room) and exterior corridor. Fuel load consisted of typical residential furnishings in the bedroom and living room along with carpet and carpet pad throughout the structure. The target room (used to assess tenability in a potential place of refuge for occupants or firefighters) did not contain any furnishings. Different types of doors (metal, hollow core wood, etc.) were used in the tests to evaluate performance under realistic fire conditions.

Two ventilation openings were provided, a ceiling vent in the Northwest Corridor (providing a flow path from the involved compartment(s) into the corridor) and a window (fitted with glass) in the compartment of origin. During the fire tests, the window failed due to differential heating (of the inner and outer surface of the glass) and was subsequently removed by researchers to provide the full window opening for ventilation.

Figure 1. Isometric Illustration of the Test Structure

isometric_floor_plan

Note: The location of fuel packages in the bedroom and living room is shown on the Floor Plan provided in Wind Driven Fires post.

The structure was constructed under a large oxygen consumption calorimetry hood which allowed measurement of heat release rate (once products of combustion began to exit the ceiling vent). In addition, thermocouples, heat flux gages, pressure transducers, and bidirectional probes were used to measure temperature, heat flux, pressure, and gas flow within and out of the structure. Gas sampling probes were located at upper and lower levels, (0.61 m (2′) and 1.83 m (6′) below the ceiling respectively) in the bedroom and living room. Researchers measured oxygen, carbon dioxide, carbon monoxide, and total hydrocarbon concentration during each test.

Experiment 1 Baseline Test

This experiment was different than the others in the series as no external wind was applied to the structure. The fire was ignited in the bedroom and allowed to develop from incipient to fully developed stage in the bedroom.

After 60 seconds the fire had extended from the trash can (first fuel package ignited) to the bed and chair. At this point a visible smoke layer had developed in the bedroom.

120 seconds after ignition, the smoke layer had reached a thickness of 1.2 m (4′) in the bedroom, hallway, and living room. At this point, smoke had just started to enter the corridor. Conditions in the target room were tenable with little smoke infiltration.

At 180 seconds after ignition, the smoke layer was 1.5 m (5′) deep and had extended from the living room into the corridor. Flames from the bed and chair had reached the ceiling. Hot smoke and clear air was well stratified with a distinct boundary between upper and lower layers. Smoke had begun to infiltrate at the top of the door to the target room.

240 seconds after ignition the window started to fail due to flame impingement and the smoke layer extended from ceiling to floor in the bedroom. The smoke layer in the living room had reached a depth of 2.1 m (7′) from the ceiling. Temperature in the corridor remained well stratified.

248 seconds after ignition the researchers cleared the remaining glass from the window to provide a full opening for ventilation. As the glass was removed, the size of the fire in the bedroom and flames exiting the window increased. A thin smoke layer had developed at ceiling level in the target room.

At 300 seconds, flames had begun to burn through the wood, hollow core door to the target room and flaming combustion is also visible in the hallway at the bottom of this door. Flames continued to exit the top 2/3 of the window.

360 seconds into the test, the fire in the bedroom reached steady state (post-flashover), ventilation controlled combustion. The door to the target room has burned through with a dramatic increase in temperature as the room fills with smoke.

Suppression using fixed sprinklers and a hoseline began at 525 seconds.

Fire development during this experiment was not particularly remarkable with conditions that could typically be expected in a residential occupancy. So, what can we learn from this test?

Heat Release Rate

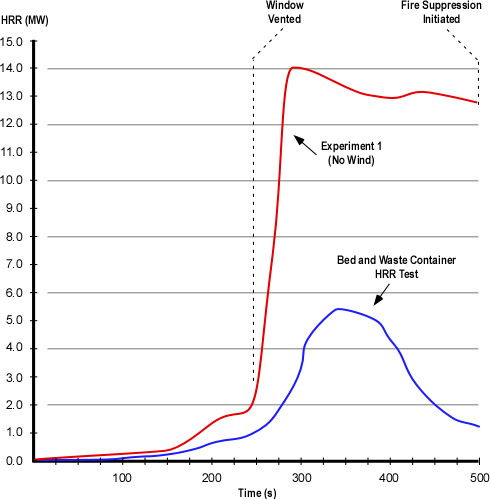
NIST researchers examined the heat release rate of individual fuel packages and combinations of fuel packages prior to the compartment fire tests. These tests conducted in an oxygen consumption calorimeter were performed with the fire in a fuel controlled burning regime. Figure 2 illustrates the heat release rate from the combination of waste container and bed fuel packages and the heat release rate generated during Experiment 1 (in which the initial fuel packages ignited were the waste container and bed located inside the bedroom.

Figure 2. Heat Release Rate Comparison

hrr_comparison

Note: Adapted from Firefighting Tactics Under Wind Driven Conditions.

Questions: Examine the heat release rate curves in Figure 2 and answer the following questions:

  • Why are these two HRR curves different shapes?
  • In each of these two cases, what might have influenced the rate of change (increase or decrease in HRR) and peak HRR?
  • What observations can you make about conditions inside the test structure and heat release rate (in particular, compare the HRR and conditions at approximately 250 and 350 seconds)?

Temperature

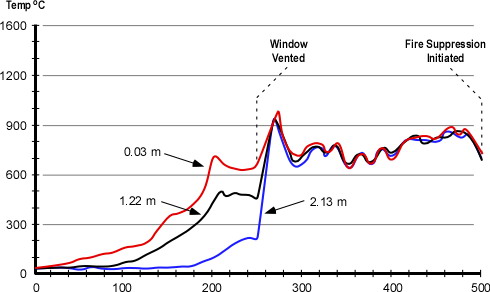
During the experiments temperature was measured in each of the compartments at multiple levels. Figure 3 illustrates temperature conditions in the bedroom at 0.03 m (1″), 1.22 m (4′) and 2.13 m (7′) down from the ceiling during Experiment 1.

Figure 3. Bedroom Temperature

bedroom_temp

Note: Adapted from Firefighting Tactics Under Wind Driven Conditions. Position.

Questions: Examine the temperature curves in Figure 3 and answer the following questions:

  • What can you determine from the temperature curves from ignition until approximately 250 seconds?
  • How does temperature change at approximately 250 seconds? Why did this change occur and how does this relate to the data presented in the HRR curve for Experiment 1 (Figure 2)?
  • What happens to the temperature at the upper, mid, and lower levels after around 275 seconds? Why does this happen?

Total Hydrocarbons

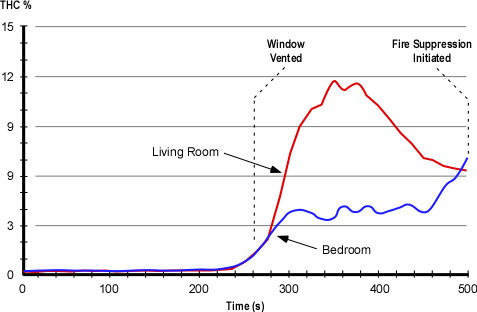
In addition to HRR and temperature, researchers measured gas concentrations inside the compartments at the upper and lower levels. Figure 4 shows the concentration (in % volume) of total hydrocarbons in the bedroom and living room. Concentration of total hydrocarbons is a measure of gas phase fuel (pyrolysis products) in the upper layer.

Figure 4. Total Hydrocarbons at the Upper Level

upper_level_thc

Note: Adapted from Firefighting Tactics Under Wind Driven Conditions. Position.

Questions: Examine the THC curves in Figure 4 and answer the following questions:

  • Why did the THC concentration in the living room rise to a higher level than in the bedroom?
  • Why didn’t the gas phase fuel in the living room burn?
  • How did the concentration of THC in the bedroom reach approximately 4%? Why wasn’t this gas phase fuel consumed by the fire?

The Story Continues…

My next post will address the answers to these questions (please feel free to post your thoughts) and provide an overview of NIST’s initial tests on the use of wind control devices for anti-ventilation.

Ed Hartin, MS, EFO, MIFireE, CFO

Wind Driven Fires

Monday, March 2nd, 2009

Weather, Topography, and Fuel

In S-190 Introduction to Wildland Fire Behavior, firefighters learn that weather, topography, and fuel and the principal factors influencing fire behavior in the wildland environment. How might this important concept apply when dealing with fires in the built environment? Factors influencing compartment fire behavior have a strong parallel to those in the wildland environment. Principal influences on compartment fire behavior include fuel, configuration (of the compartment and building), and ventilation.

Wind Driven Compartment Fires

As buildings are designed to minimize the influence of weather on their contents and occupants, weather is not generally considered a major factor in compartment fires. However, this is not always the case. As wildland firefighters recognize, wind can be a major influence on fire behavior and strong winds present a significant threat of extreme fire behavior.

Under fire conditions, unplanned ventilation involves all changes influencing exhaust of smoke, air intake, and movement of smoke within the building that are not part of the incident action plan. These changes may result from the actions of exiting building occupants, fire effects on the building (e.g., failure of window glass), or a wide range of other factors.

Changes in ventilation can increase fire growth and hot smoke throughout the building. Failure of a window in the fire compartment in the presence of wind conditions can result in a significant and rapid increase in heat release. If this is combined with open doors to corridors, unprotected stairwells, and other compartments, wind driven fire conditions have frequently resulted in firefighter injuries and fatalities (see Additional Reading).

NIST Research on Wind Driven Fires

From November 2007 to January 2008, the National Institute of Standards and Technology conducted a series of experiments examining firefighting tactics dealing with wind driven compartment fires. The primary focus of this research was on the dynamics of fire growth and intensity and the influence of ventilation and fire control strategies under wind driven fire conditions. The results of these experiments are presented in Fire Fighting Tactics Under Wind Driven Conditions, published by The Fire Protection Research Foundation.

Tests conducted at NIST’s Large Fire Test Facility (see Figure 1) included establishment of baseline heat release data for the fuels (bed, chairs, sofa, etc), full scale fire tests under varied conditions (e.g., no wind, wind), and experiments involving control of the inlet opening and varied methods of external water application.

Figure 1. NIST Large Fire Test Facility

nist_large_fire_facility

Note: Photo adapted from Firefighting Tactics Under Wind Driven Conditions.

The objectives of this study were:

  • To understand the impact of wind on a structure fire fueled with residential furnishings in terms of temperature, heat flux, heat release rate, and gas concentrations
  • To quantify the impact of several novel firefighting tactics on a wind driven structure fire
  • Improve firefighter safety

After conducting a series of tests to determine the heat release rate characteristics of the fuels to be used for the full scale tests, NIST conducted eight full scale experiments to examine the impact of wind on fire spread through the multi-room test structure (see Figure 2) and examine the influence of anti-ventilation using wind control devices and the impact of external water application.

Multi-Room Test Structure

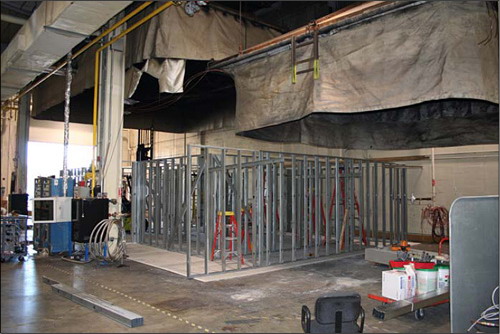
All tests were conducted under the 9 m (30′) x 12 m (40′) oxygen consumption calorimetry hood at the NIST Large Fire Test Facility. The test structure was comprised of three compartments; Bedroom, Target Room (used to assess tenability in a compartment adjacent to the ventilation flow), and Living Room, along with an interconnecting hallway and exterior hallways. A large mechanical fan was positioned 7.9 m (26′) away from the window in the bedroom of the test structure (see Figure 2) to provide consistent wind conditions for the experiments.

Figure 2. Configuration of the Multi-Room Test Structure

test_floor_plan

Note: Adapted from Firefighting Tactics Under Wind Driven Conditions.

The structure was framed with steel studs and wood truss joist I-beams (TJIs) used to support the ceiling. The interior of the compartments were lined with three layers of 13 mm (1/2″) gypsum board. Multiple layers of gypsum board were used to provide the durability required for repetitive experiments (the inner layer was replaced and repairs made to other layers as needed between experiments).

Used furnishings were purchased from a hotel liquidator to obtain 10 sets of similar furniture to use in the heat release rate and full-scale, multi-compartment experiments. Fuel used in the tests included furniture, nylon carpet, and polyurethane carpet padding (the position major furniture items are illustrated in Figures 2 and 3).  Fuel load was 348.69 kg (768.73 lbs) in the bedroom, 21.5 kg (47.40 lbs) in the hallway, and 217.6 kg (479.73 lbs) in the living room (no contents were placed in the target room).

Figure 3. Bedroom and Living Room Fuel Load

contents

Note: Photos adapted from Firefighting Tactics Under Wind Driven Conditions.

NIST researchers conducted a series of eight full-scale, multi-compartment fire tests. In each case, a fire was started in the Bedroom using a plastic trash container placed next to the bed (see Figure 3).

Figure 3. Placement of the Trash Container

placement_trash_container

Note: Photos adapted from Firefighting Tactics Under Wind Driven Conditions.

Experiments

The eight tests provided the opportunity to study the dynamics of wind driven compartment fires and several different approaches to limiting the influence of air intake and controlling the fire.

Experiment 1: This test was performed to establish baseline conditions with no wind

Experiment 2: Evaluation of anti-ventilation using a large wind control device placed over the window

Experiment 3: Evaluation of anti-ventilation using a large wind control device placed over the window (second test with a longer pre-burn before deployment of the wind control device).

Experiment 4: Evaluation of anti-ventilation and water application using a small wind control device and 30 gpm (113.6 lpm) spray nozzle from under the wind control device.

Experiment 5: Evaluation of anti-ventilation and water application using a small wind control device and 30 gpm (113.6 lpm) spray nozzle from under the wind control device (second test with a lower wind speed)

Experiment 6: No wind control device, application of water using a hoseline equipped with a combination nozzle at 90 psi (621 kPa) nozzle pressure, providing a flow rate of 80 gpm (303 lpm).

Experiment 7: No wind control device, application of water using a hoseline equipped with a 15/16″ smooth bore nozzle at 50 psi (345 kPa) nozzle pressure, providing a flow rate of 160 gpm (606 lpm) (test was conducted with the living room corridor door closed).

Experiment 8: No wind control device, application of water using a hoseline equipped with a 15/16″ smooth bore nozzle at 50 psi (345 kPa) nozzle pressure, providing a flow rate of 160 gpm (606 lpm) (second test with the living room corridor door open).

Note: The nozzles for these tests (100 gpm at 100 psi combination nozzle and 15/16″ solid stream nozzle were selected as to be representative of those used by the fire service in the United States (personal correspondence, S. Kerber, February 28, 2009). However, it is important to note that in comparing the results, that the combination nozzle was under pressurized (80 psi, rather than 100 psi) resulting in large droplet size. In addition, the 100 gpm flow rate was 50% of that applied through the solid stream nozzle and is likely considerably lower than the flow capability of combination nozzles typically used with 1-3/4″ (45 mm) hose.

Important Findings

The first experiment was conducted without any external wind or tactical intervention. The baseline data generated during this test was critical to evaluating the outcome of subsequent experiments and demonstrated a number of concepts that are critical to firefighter safety:

Smoke is fuel. A ventilation limited (fuel rich) condition had developed prior to the failure of the window. Oxygen depleted combustion products containing carbon dioxide, carbon monoxide and unburned hydrocarbons, filled the rooms of the structure. Once the window failed, the fresh air provided the oxygen needed to sustain the transition through flashover, which caused a significant increase in heat release rate.

Venting does not always equal cooling. In this experiment, post ventilation temperatures and heat fluxes all increased, due to the ventilation induced flashover.

As discussed in early posts, Fuel & Ventilation and Myth of the Self Vented Fire understanding the relationship between oxygen and heat release rate, the hazards presented by ventilation controlled fires, and the influence of ventilation on fire development is critical to safe and effective fireground operations.

Fire induced flows. Velocities within the structure exceeded 5 m/s (11 mph), just due to the fire growth and the flow path that was set-up between the window opening and the corridor vent.

Avoid the flow path. The directional nature of the fire gas flow was demonstrated with thermal conditions, both temperature and heat flux, which were twice as high in the “flow” portion of the corridor as opposed to the “static” portion of the corridor in Experiment 1 [not wind driven]. Thermal conditions in the flow path were not consistent with firefighter survival.

Previous posts have presented case studies based on incidents in Loudoun County Virginia and Grove City, Pennsylvania in which convective flow was a significant factor rapid fire progress that entrapped and injured firefighters, in one case fatally. Previous NIST research investigating a multiple line-of-duty death that occurred in a townhouse fire at 3146 Cherry Road in Washington, DC in 1999 also emphasized the influence of flow path on fire conditions and tenability.

More to Follow

Subsequent posts will examine the NIST wind driven fire tests in greater detail.

Ed Hartin, MS, EFO, MIFireE, CFO

References

Madrzykowski, D. & Kerber, S. (2009). Fire Fighting Tactics Under Wind Driven Conditions. Retrieved (in four parts) February 28, 2009 from http://www.nfpa.org/assets/files//PDF/Research/Wind_Driven_Report_Part1.pdf; http://www.nfpa.org/assets/files//PDF/Research/Wind_Driven_Report_Part2.pdf;http://www.nfpa.org/assets/files//PDF/Research/Wind_Driven_Report_Part3.pdf;http://www.nfpa.org/assets/files//PDF/Research/Wind_Driven_Report_Part4.pdf.

Madrzykowski, D. & Vettori, R. (2000). Simulation of the Dynamics of the Fire at 3146 Cherry Road NE, Washington D.C., May 30, 1999. Retrieved March 1, 2009 from http://fire.nist.gov/CDPUBS/NISTIR_6510/6510c.pdf

Additional Reading

The following investigative reports deal with firefighter line of duty deaths involving wind driven fire events during structural firefighting.

National Institute for Occupational Safety and Health (NIOSH). (1999). Death in the line of duty, Report F99-01. Retrieved February 28, 2009 from http://www.cdc.gov/niosh/fire/pdfs/face9901.pdf

National Institute for Occupational Safety and Health (NIOSH). (1999). Death in the line of duty, Report F98-26. Retrieved February 28, 2009 from http://www.cdc.gov/niosh/fire/pdfs/face9826.pdf

National Institute for Occupational Safety and Health (NIOSH). (2002). Death in the line of duty, Report F2001-33. Retrieved February 28, 2009 from http://www.cdc.gov/niosh/fire/pdfs/face200133.pdf

National Institute for Occupational Safety and Health (NIOSH). (2007). Death in the line of duty, Report F2005-03. Retrieved February 28, 2009 from http://www.cdc.gov/niosh/fire/pdfs/face200503.pdf

National Institute for Occupational Safety and Health (NIOSH). (2008). Death in the line of duty, Report F2007-12. Retrieved February 28, 2009 from http://www.cdc.gov/niosh/fire/pdfs/face200712.pdf

Prince William County Department of Fire and Rescue (2007). Line of duty investigative report: Technician I Kyle Wilson. Retrieved February 28, 2009 from http://www.pwcgov.org/default.aspx?topic=040061002930004566

Texas State Fire Marshal’s Office. (2001). Firefighter Fatality Investigation, Investigation Number 02-50-10. Retrieved February 28, 2009 from http://www.tdi.state.tx.us/reports/fire/documents/fmloddjahnke.pdf

Hazard of Ventilation Controlled Fires

Thursday, October 9th, 2008

In the Grading the Fireground on a Curve, published in the September issue of Firehouse magazine, Battalion Chief Mark Emery warned of the hazards of assuming that limited volume and velocity of visible smoke indicates a growth stage fire. He correctly identified that compartment fires may enter the decay phase as fuel is consumed or due to a lack of oxygen.

Emery cites National Institute for Occupational Safety and Health (NIOSH) Death in the Line of Duty reports 98-F07 and F2004-14, in which firefighters initiated offensive fire attack in commercial buildings and encountered rapidly deteriorating fire conditions due to changes in the ventilation profile. Concluding the introduction to his article, Emery observes “Unless you know which side of the fire growth curve you are entering, advancing into zero-visibility conditions is really a bad idea”.

I agree with BC Emery’s basic premise that appearances can be deceiving. However, this article points to two interrelated issues. The hazards presented by ventilation controlled fires and the dangerous conditions presented by enclosed buildings. In Smoke Burns,originally published on Firehouse.com I discussed the hazards of ventilation controlled fire and the relationship of burning regime to extreme fire behavior phenomena such as flashover and backdraft. The hazards presented by ventilation controlled fires are compounded when the fire occurs in an enclosed structure (a building with limited means of access and egress). Captain Willie Mora has written extensively on Enclosed Structure Disorientation on Firehouse.com.

BC Emery illustrated how appearances can be deceiving using data and still images from a full scale fire test in a warehouse in Phoenix, Arizona conducted by the National Institute for Standards and Technology (NIST). NIST conducted these tests as part of a research project on structural collapse. However, the video footage and temperature data from this test is extremely useful in studying the influence of ventilation on fire behavior and fire behavior indicators (Building, Smoke, Air Track, Heat, and Flame (B-SAHF)). The full report and video from this test is available on-line from the NIST Building Fire Research Laboratory (BFRL).

As an oxidation reaction, combustion requires oxygen to transform the chemical potential energy in fuel to thermal energy. If a developing compartment fire becomes ventilation controlled, with heat release rate limited by the oxygen available in the compartment, pyrolysis will continue as long as temperature in the compartment is above several hundred degrees Celsius. Pyrolysis products in smoke are gas phase fuel ready to burn. Increased ventilation at this point, may cause the fire to quickly transition to the fully developed stage (ventilation induced flashover). However, if the fire continues to burn in a ventilation controlled state and the concentration of gas phase fuel (pyrolysis products and flammable products of incomplete combustion) increases sufficiently, increased ventilation may result in a backdraft.

I take issue with BC Emery’s illustration of the growth side of the fire development curve as the value side of the cure and the decay side of the curve as the no value side of the curve. Depending on resources, a fire on the growth side of the curve may exceed the offensive fire control capability of the fire department. Conversely, a fire on the decay side of the curve which is limited to a single compartment or series of compartments may be effectively controlled using an appropriate tactics in an offensive strategic mode. However, Emery’s discussion of the more subtle indicators of burning regime that may warn firefighters of a ventilation controlled fire is right on track. For more information on fire behavior indicators and fire development, see Fire Behavior Indicators and Fire Development Parts I and II on Firehouse.com.

Ed Hartin, MS, EFO, MIFireE, CFO