NIST Wind Driven Fire Experiments:
Wind Control Devices & Fire Suppression
Thursday, March 12th, 2009
Continuing examination of NIST’s research on Firefighting Tactics Under Wind Driven Conditions, this post looks at the results of experiments involving use of wind control devices and external water application.
In my last post, I posed several questions about wind control devices to “prime the pump” regarding wind driven fires and potential applications for use of wind control devices.
Questions
Give some thought to how wind can influence compartment fire behavior and how a wind control device might mitigate that influence.
- How would a strong wind applied to an opening (such as the bedroom window in the NIST tests) influence fire behavior in the compartment of origin and other compartments in the structure?
- How would deployment of a wind control device influence fire behavior?
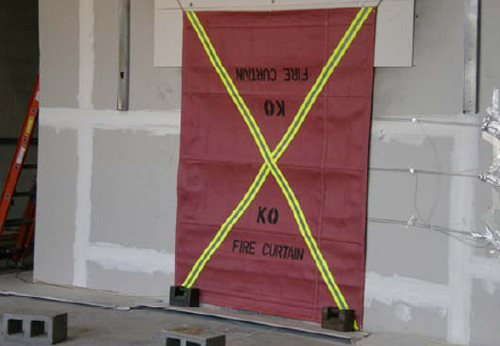
- While the wind control device illustrated in Figure 5 was developed for use in high-rise buildings, what applications can you envision in a low-rise structure?
- What other anti-ventilation tactics could be used to deal with wind driven fires in the low-rise environment?
Answers: Thornton’s Rule indicates that the amount of oxygen required per unit of energy released from many common hydrocarbons and hydrocarbon derivatives is fairly constant. Each kilogram of oxygen used in the combustion of common organic materials results in release of 13.1 MJ of energy. Fully developed compartment fires are generally ventilation controlled (potential heat release rate (HRR) based on fuel load exceeds the actual HRR given the atmospheric oxygen available through existing ventilation openings). Application of wind can dramatically increase heat release rate by increasing the mass of oxygen available for combustion. In addition to increasing HRR, wind can significantly increase the velocity of hot fire gases and flames (and resulting convective and radiant heat transfer) between the inlet and outlet openings.
Deployment of a wind control device to cover an inlet opening (window or door), limits oxygen available for combustion to the air already in the structure and normal building leakage. In addition, blocking the wind will also reduce gas and flame velocity between the inlet and outlet.
While wind driven fires are problematic in high-rise buildings, the same problem can be encountered in low-rise structures and wind control devices may prove useful in some circumstances. However, exterior attack (discussed later in this post) is more feasible than in a high-rise building and other tactics such as door control may also prove essential in managing hazards presented by wind.
Test Conditions
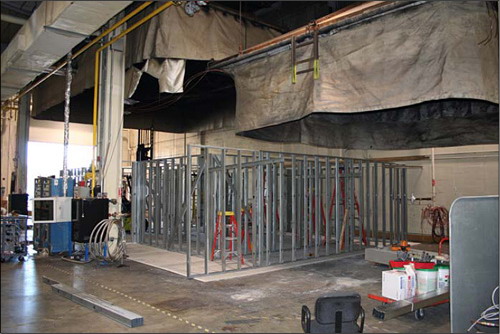
As outlined in my earlier post, Wind Driven Fires, NIST conducted a number of different wind driven tests using the same multi-compartment structure. Experiment 3 involved evaluation of anti-ventilation tactics using a large wind control device placed over the bedroom window. Wind conditions of 6.7 m/s to 8.9 m/s (15 mph-20 mph) were maintained throughout the test.
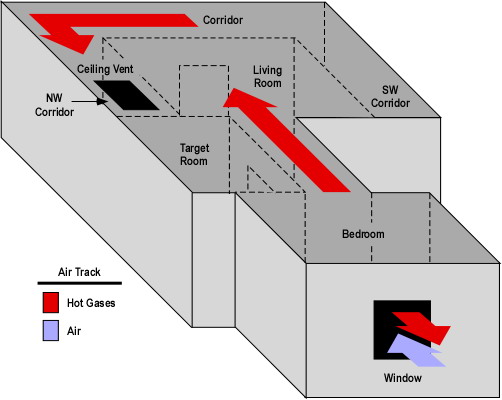
As with the baseline test, two ventilation openings were provided. A ceiling vent in the Northwest Corridor and a window (fitted with glass) in the bedroom (compartment of origin). During the test the window failed due to fire effects and was subsequently fully cleared by the researchers to provide a full window opening for ventilation.
Figure 1. Isometric Illustration of the Test Structure
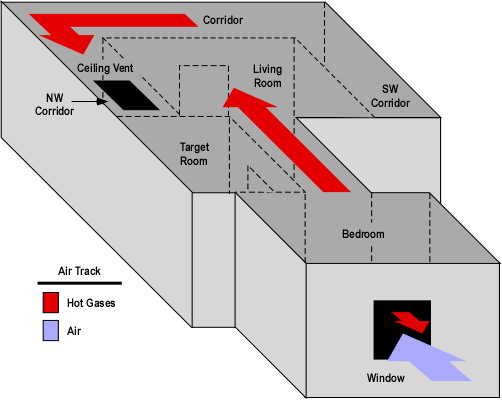
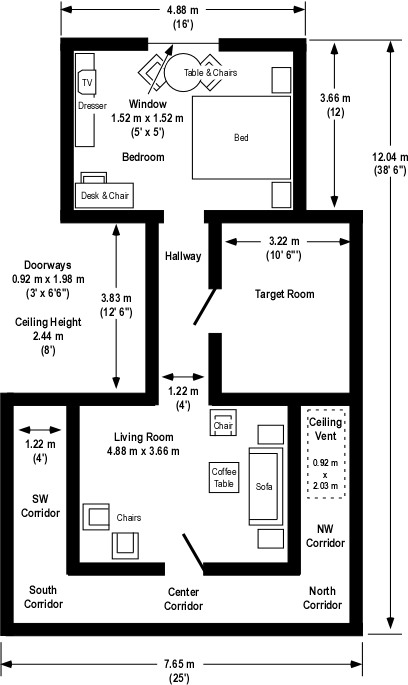
Note: The location of fuel packages in the bedroom and living room is shown on the Floor Plan provided in Wind Driven Fires post.
Experiment 3 Wind Driven Fire
This experiment was one of several that investigated wind driven fire behavior and the effectiveness of a wind control device deployed over the bedroom window to limit inward airflow. The fire was ignited in the bedroom and allowed to develop from incipient to fully developed stage in the bedroom.
The fire progressed in a similar manner as observed in the baseline test described in my earlier post NIST Wind Driven Fire Experiments: Establishing a Baseline. In this experiment the fire involving the initial fuel packages (bed and waste container) and visible smoke layer developed slightly more slowly. However, the bedroom window failed more completely and 11 seconds earlier than in the baseline test.
Almost immediately after the window failed, turbulent flaming combustion filled the bedroom and hot gases completely filled the door between the living room and corridor and were impinging on the opposite wall. At 222 seconds (15 seconds after the window was completely cleared) flames were visible in the corridor and the hollow core wood door in the target room was failing with flames breaching the top corners of the door and a smoke layer developing in the target room. While most of the hot gases and flames were driven through the interior (towards the ceiling vent in the corridor), flames continued to flow out the top of the window opening (against the wind).
At 266 seconds conditions had further deteriorated in all compartments with no visibility in the corridor and increased deterioration of the door to the target room. At this point the air track at the window was completely inward (no flames outside the window).
The wind control device was deployed at 270 seconds. Unfortunately soot on the video cameras lenses precluded a good view of interior conditions. However, video from the thermal imaging camera no longer showed any flow of hot gases into the corridor (only high temperature).
At 330 seconds, shortly after removal of the wind control device flames were visible in the bedroom and the fire quickly progressed to a fully developed state. At 360 seconds, flames were pulsing out the window opening (against the wind).
The experiment was ended at 380 seconds and the fire was extinguished.
Heat Release Rate
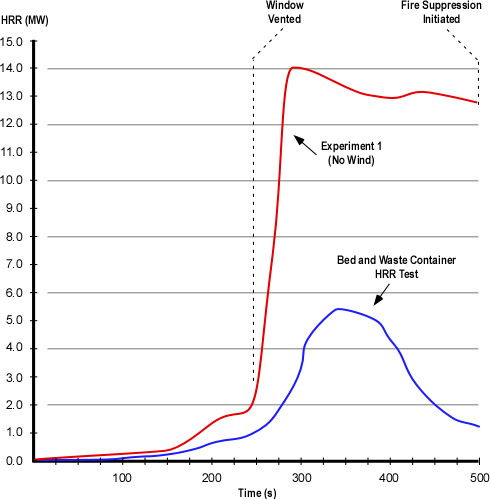
As with the baseline test NIST researchers recorded heat release rate data during Experiment 3. As discussed earlier in this post, application of wind increased the amount of oxygen available for combustion and resulting heat release rate in comparison to the baseline test.
Figure 2. Heat Release Rates in Experiments 1 (Baseline) and 3 (Wind Driven)
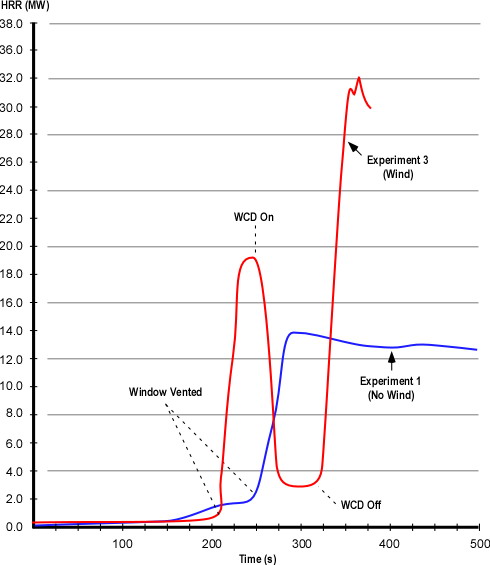
Note: Adapted from Firefighting Tactics Under Wind Driven Conditions.
Questions: Examine the heat release rate curves in Figure 2 and answer the following questions:
- What effect did deployment of the wind control device have on HRR and why did this change occur so quickly?
- How did HRR change when the wind control device was removed and why was this change different from when the window was vented?
- What factors might influence the extent to which HRR changes when ventilation is increased to a compartment fire in a ventilation controlled burning regime?
Wind Control Device Research and Application
NIST has continued research into the practical application of wind control devices with tests in Chicago and New York involving large apartment buildings and realistic fuel loading. For additional information on these tests and video of wind control device deployment, visit the NIST Wind Driven Fires webpage.
Fire Control Experiments
NIST researchers also conducted a series of experiments in the same structure examining the impact of various fire control tactics. These included application of water using solid stream and combination nozzles (using a 30o fog pattern with continuous application). In addition, they examined the influence of coordinated deployment of a wind control device and low flow water application of water fog). In each of these tests, water was applied from the exterior of the structure through the bedroom window.
Water Fog Application: Experiment 6 involved application of water using a hoseline equipped with a combination nozzle at 90 psi (621 kPa) nozzle pressure, providing a flow rate of 80 gpm (303 lpm). The fog stream was initially applied across the window (no discharge into the bedroom). This had a limited effect on conditions on the interior. When applied into the room, the 30o fog pattern was positioned to almost completely fill the window. This action resulted in a brief increase (approximately 4 MW) and then a dramatic reduction in HRR.
Solid Stream Application: Experiments 7 and 8 involved application of water using a hoseline equipped with a 15/16″ smooth bore nozzle at 50 psi (345 kPa) nozzle pressure, providing a flow rate of 160 gpm (606 lpm). The solid stream was initially directed at the ceiling and then in a sweeping motion across the ceiling. In Experiment 8, the stream was then directed at burning contents in the compartment. Application of the solid stream had a pronounced effect, dramatically reducing heat release rate in both experiments.
Conditions varied considerably between these three tests (Experiments 6-8). This makes direct comparison of the results somewhat difficult. However, several conclusions can be drawn from the data:
- Exterior application of water can be effective in reducing HRR in wind driven fires.
- Both solid stream and fog application can be effective in reducing HRR under these conditions.
- Continuous application of water fog positioned to nearly fill the inlet opening develops substantial air flow which can increase HRR (this works similar to the process of hydraulic ventilation, but in reverse).
- A high flow solid stream may be more effective (but not necessarily more efficient) than a lower flow fog pattern if a direct attack on burning contents can be made.
Coordinated WCD Deployment and Water Application: Experiments 4 and 5 involved evaluations of anti-ventilation and water application using a small wind control device and 30 gpm (113.6 lpm) spray nozzle from under the wind control device. The effectiveness of the wind control device was similar to other anti-ventilation tests and application of low flow water fog resulted in continued decrease in HRR throughout the experiment.
Ed Hartin, MS, EFO, MIFireE, CFO
References
Madrzykowski, D. & Kerber, S. (2009). Fire Fighting Tactics Under Wind Driven Conditions. Retrieved (in four parts) February 28, 2009 from http://www.nfpa.org/assets/files//PDF/Research/Wind_Driven_Report_Part1.pdf; http://www.nfpa.org/assets/files//PDF/Research/Wind_Driven_Report_Part2.pdf;http://www.nfpa.org/assets/files//PDF/Research/Wind_Driven_Report_Part3.pdf;http://www.nfpa.org/assets/files//PDF/Research/Wind_Driven_Report_Part4.pdf.


