Posts Tagged ‘NIST’

NIST Wind Driven Fire Experiments:
Anti-Ventilation-Wind Control Devices

Monday, March 9th, 2009

My last post asked a number of questions focused on results of baseline compartment fire tests conducted by the National Institute for Standards and Technology (NIST) as part of a research project on  Firefighting Tactics Under Wind Driven Conditions.  This post looks at the answers to these questions and continues with an examination of NIST’s experiments in the application of wind control devices for anti-ventilation.

Questions

Generally being practically focused people, firefighters do not generally dig into research reports. However, the information on the baseline test conducted by NIST raised several interesting questions that have direct impact on safe and effective firefighting operations. First consider possible answers to the questions and then why this information is so important (the “So what?”!).

Figure 1. Heat Release Rate Comparison
hrr_comparison

Note: Adapted from Firefighting Tactics Under Wind Driven Conditions.

Heat Release Rate (HRR) Questions: Examine the heat release rate curves in Figure 1 and answer the following questions:

  • Why are these two HRR curves different shapes?
  • In each of these two cases, what might have influenced the rate of change (increase or decrease in HRR) and peak HRR?
  • What observations can you make about conditions inside the test structure and heat release rate (in particular, compare the HRR and conditions at approximately 250 and 350 seconds)?

Answers: The HRR test for the bed and waste container was conducted under fuel controlled conditions (oxygen supply was not restricted). The higher HRR in the compartment fire experiment results from increased fuel load (e.g., additional furniture, carpet). After reaching its peak, HRR in the compartment fire drops off slowly as the fire becomes ventilation controlled and the fire continues in a relatively steady state of combustion (limited by the air supplied through the lower portion of the bedroom window)

The rate of change in heat release rate under fuel controlled conditions is dependent on the characteristics and configuration of the fuel.  However, in the case of the compartment fire test, the rate of change is also impacted by limited ventilation. As illustrated in the compartment fire curve, the fire quickly became ventilation controlled and HRR rose slowly until the window failed and was fully cleared by researchers.

At 250 seconds (when the window was vented) HRR rose extremely rapidly as the fire in the bedroom rapidly transitioned from the growth through flashover to fully developed stage. At 350 seconds the fire had again become ventilation controlled and was burning in a relatively steady state limited by the available oxygen.

The fully developed fire in the bedroom also became ventilation controlled due to limited ventilation openings, resulting in HRR leveling off with relatively steady state combustion based on the available oxygen.

Figure 2. Bedroom Temperature
bedroom_temp

Note: Adapted from Firefighting Tactics Under Wind Driven Conditions.

Temperature Questions: Examine the temperature curves in Figure 2 and answer the following questions:

  • What can you determine from the temperature curves from ignition until approximately 250 seconds?
  • How does temperature change at approximately 250 seconds? Why did this change occur and how does this relate to the data presented in the HRR curve for Experiment 1 (Figure 1)?
  • What happens to the temperature at the upper, mid, and lower levels after around 275 seconds? Why does this happen?

Answers: Temperature at the upper levels of the compartment increased much more quickly than at the lower level and conditions in the compartment remained thermally stratified until the ceiling temperature exceeded 600o C. At approximately 250 seconds, the compartment flashed over resulting in a rapid increase in temperature at mid and lower levels. This change correlates with the rapid increase in HRR occurring at approximately 250 seconds in Figure 1. Turbulent, ventilation controlled combustion resulted in a loss of thermal layering with temperatures in excess of 600o C from ceiling to floor. At around 275 seconds.

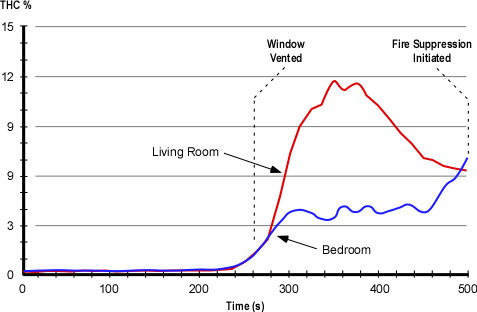
Figure 3. Total Hydrocarbons at the Upper Level
upper_level_thc

Note: Adapted from Firefighting Tactics Under Wind Driven Conditions.

Total Hydrocarbons (THC) Questions: Examine the THC curves in Figure 3 and answer the following questions:

  • Why did the THC concentration in the living room rise to a higher level than in the bedroom?
  • Why didn’t the gas phase fuel in the living room burn?
  • How did the concentration of THC in the bedroom reach approximately 4%? Why wasn’t this gas phase fuel consumed by the fire?

Answers: Oxygen entering the compartments through the window was being used by combustion occurring in the bedroom. Low oxygen concentration limited combustion in the living room and allowed accumulation of a higher concentration of unburned fuel. While the oxygen concentration in the bedroom was higher, the fire was still ventilation controlled and not all of the gas phase fuel was able to burn inside this compartment.

So What?

What do the answers to the preceding questions mean to a company crawling down a dark, smoky hallway with a hoseline or making a ventilation opening at a window or on the roof?

Emergency incidents do not generally occur in buildings equipped with thermocouples, heat flux gages, gas monitoring equipment, and pre-placed video and thermal imaging cameras. Understanding the likely sequence of fire development and influencing factors is critical to not being surprised by fire behavior phenomena. These tests clearly illustrated how burning regime (fuel or ventilation controlled) impacts fire development and how changes in ventilation can influence fire behavior. The total hydrocarbon concentration and ventilation controlled combustion in the living room would present a significant threat in an emergency incident. How might conditions change if the fire in the bedroom was controlled and oxygen concentration began to increase? Ignition of the gas phase fuel in this compartment could present a significant threat (see Fire Gas Ignitions) or even prove deadly (future posts will examine the deaths of a captain and engineer in a fire gas ignition in California).

Anti-Ventilation

For years firefighters throughout the United States have been taught that ventilation is “the planned and systematic removal of heat, smoke, and fire gases, and their replacement with fresh air”. This is not entirely true! Ventilation is simply the exchange of the atmosphere inside a compartment or building with that which is outside. This process goes on all the time. What we have thought of as ventilation, is actually tactical ventilation. This term was coined a number of years ago by my friend and colleague Paul Grimwood (London Fire Brigade, retired). It is essential to recognize that there are two sides to the ventilation equation, one is removal of the hot smoke and fire gases and the other is introduction of air. Increased ventilation can improve tenability of the interior environment, but under ventilation controlled conditions will result in increased heat release rate.

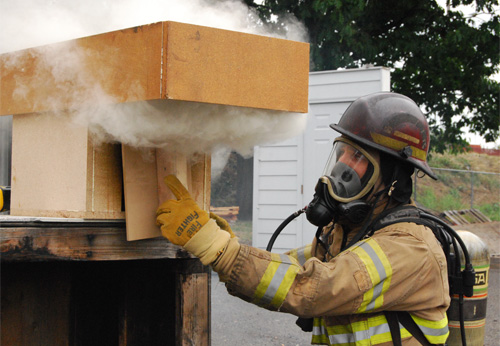
Another tactic change the ventilation profile and influence fire behavior and conditions inside the building is to confine the smoke and fire gases and limit introduction of air (oxygen) to the fire. Firefighters in the United States often think of this as confinement, but I prefer the English translation of the Swedish tactic, anti-ventilation. This is the planned and systematic confinement of heat, smoke, and fire gases and exclusion of fresh air. The concept of anti-ventilation is easily demonstrated by limiting the air inlet during a doll’s house demonstration (see Figure 4). Closing the inlet dramatically reduces heat release rate and if sustained, can result in extinguishment.

Figure 4. Anti-Ventilation in a Doll’s House Demonstration
doll_house_door

For a more detailed discussion of the relationship between ventilation and heat release rate see my earlier post on Fuel and Ventilation.

Air Track and Influence of Wind

Air track (movement of smoke and air under fire conditions) is influenced by differences in density between hot smoke and cooler air and the location of ventilation openings. However, wind is an often unrecognized influence on compartment fire behavior. Wind direction and speed can influence movement of smoke, but more importantly it can have a dramatic influence on introduction of air to the fire.

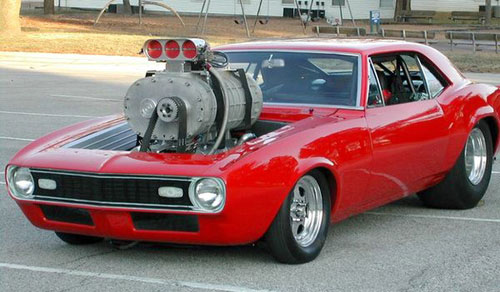
While the comparison is not perfect, the effects of wind on a compartment fire can be similar to placing a supercharger on an internal combustion engine (see Figure 5). Both dramatically increase power (energy released per unit of time).

Figure 5. Influence of Wind
supercharger

NIST Wind Control Device Tests

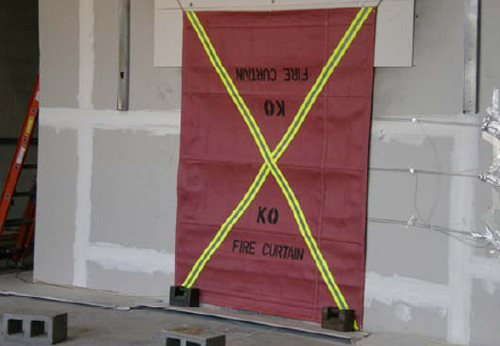
As discussed in Wind Driven Fires, the effects of wind on compartment fire behavior can present a significant threat to firefighters and has resulted in a substantive number of line-of-duty deaths. In their investigation of potential tactical options for dealing with wind driven fires, NIST researchers examined the use of wind control devices (WCD) to limit introduction of air through building openings (specifically windows in the fire compartment in a high-rise building) as illustrated in Figure 6.

Figure 6. Small Wind Control Device
wcd_small

Note: Photo from Firefighting Tactics Under Wind Driven Conditions.

Questions

Give some thought to how wind can influence compartment fire behavior and how a wind control device might mitigate that influence.

  • How would a strong wind applied to an opening (such as the bedroom window in the NIST tests) influence fire behavior in the compartment of origin and other compartments in the structure?
  • How would a wind control device deployed as illustrated in Figure 5 influence fire behavior?
  • While the wind control device illustrated in Figure 5 was developed for use in high-rise buildings, what applications can you envision in a low-rise structure?
  • What other anti-ventilation tactics could be used to deal with wind driven fires in the low-rise environment?

The Story Continues…

My next post will address the answers to these questions (please feel free to post your thoughts) and examine the results of NIST’s tests on the use of wind control devices for anti-ventilation.

References

Madrzykowski, D. & Kerber, S. (2009). Fire Fighting Tactics Under Wind Driven Conditions. Retrieved (in four parts) February 28, 2009 from http://www.nfpa.org/assets/files//PDF/Research/Wind_Driven_Report_Part1.pdf; http://www.nfpa.org/assets/files//PDF/Research/Wind_Driven_Report_Part2.pdf;http://www.nfpa.org/assets/files//PDF/Research/Wind_Driven_Report_Part3.pdf;http://www.nfpa.org/assets/files//PDF/Research/Wind_Driven_Report_Part4.pdf.

Ed Hartin, MS, EFO, MIFireE, CFO

NIST Wind Driven Fire Experiments:
Establishing a Baseline

Thursday, March 5th, 2009

My last post introduced a National Institute for Standards and Technology research project examining firefighting tactics for wind driven structure fires (particularly those occurring in high-rise buildings). The report on this research Firefighting Tactics Under Wind Driven Conditions contains a tremendous amount of information on this series of experiments including heat release rate, heat flux, pressure, velocity, and gas concentrations during each of the tests along with time sequenced still images (video and infrared video capture).

This post will examine the initial test used to establish baseline conditions for evaluation of wind driven fire conditions and tactics. Readers are encouraged to download a copy of the report and dig a bit deeper!

Test Conditions

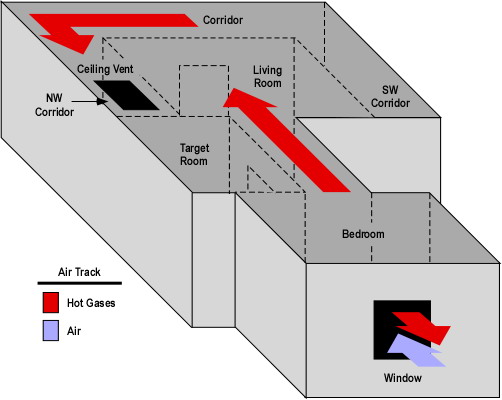
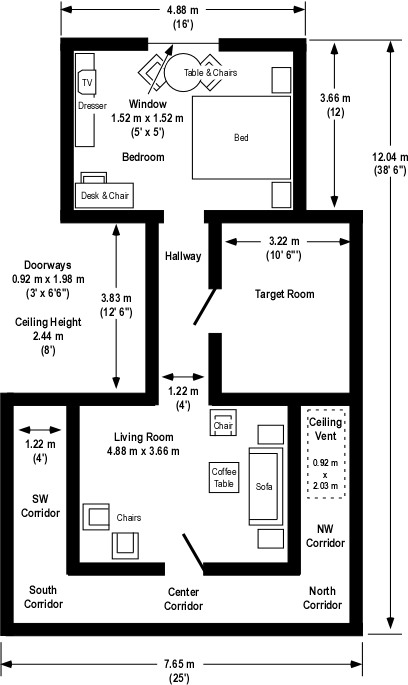
In Wind Driven Fires, I provided an overview of the multi-compartment test structure and fuel load used for this series of experiments. To quickly review, the test structure was comprised of three compartments; Bedroom, Target Room (used to assess tenability in a compartment adjacent to the ventilation flow), and Living Room, along with an interconnecting hallway (between the Bedroom and Living Room) and exterior corridor. Fuel load consisted of typical residential furnishings in the bedroom and living room along with carpet and carpet pad throughout the structure. The target room (used to assess tenability in a potential place of refuge for occupants or firefighters) did not contain any furnishings. Different types of doors (metal, hollow core wood, etc.) were used in the tests to evaluate performance under realistic fire conditions.

Two ventilation openings were provided, a ceiling vent in the Northwest Corridor (providing a flow path from the involved compartment(s) into the corridor) and a window (fitted with glass) in the compartment of origin. During the fire tests, the window failed due to differential heating (of the inner and outer surface of the glass) and was subsequently removed by researchers to provide the full window opening for ventilation.

Figure 1. Isometric Illustration of the Test Structure

isometric_floor_plan

Note: The location of fuel packages in the bedroom and living room is shown on the Floor Plan provided in Wind Driven Fires post.

The structure was constructed under a large oxygen consumption calorimetry hood which allowed measurement of heat release rate (once products of combustion began to exit the ceiling vent). In addition, thermocouples, heat flux gages, pressure transducers, and bidirectional probes were used to measure temperature, heat flux, pressure, and gas flow within and out of the structure. Gas sampling probes were located at upper and lower levels, (0.61 m (2′) and 1.83 m (6′) below the ceiling respectively) in the bedroom and living room. Researchers measured oxygen, carbon dioxide, carbon monoxide, and total hydrocarbon concentration during each test.

Experiment 1 Baseline Test

This experiment was different than the others in the series as no external wind was applied to the structure. The fire was ignited in the bedroom and allowed to develop from incipient to fully developed stage in the bedroom.

After 60 seconds the fire had extended from the trash can (first fuel package ignited) to the bed and chair. At this point a visible smoke layer had developed in the bedroom.

120 seconds after ignition, the smoke layer had reached a thickness of 1.2 m (4′) in the bedroom, hallway, and living room. At this point, smoke had just started to enter the corridor. Conditions in the target room were tenable with little smoke infiltration.

At 180 seconds after ignition, the smoke layer was 1.5 m (5′) deep and had extended from the living room into the corridor. Flames from the bed and chair had reached the ceiling. Hot smoke and clear air was well stratified with a distinct boundary between upper and lower layers. Smoke had begun to infiltrate at the top of the door to the target room.

240 seconds after ignition the window started to fail due to flame impingement and the smoke layer extended from ceiling to floor in the bedroom. The smoke layer in the living room had reached a depth of 2.1 m (7′) from the ceiling. Temperature in the corridor remained well stratified.

248 seconds after ignition the researchers cleared the remaining glass from the window to provide a full opening for ventilation. As the glass was removed, the size of the fire in the bedroom and flames exiting the window increased. A thin smoke layer had developed at ceiling level in the target room.

At 300 seconds, flames had begun to burn through the wood, hollow core door to the target room and flaming combustion is also visible in the hallway at the bottom of this door. Flames continued to exit the top 2/3 of the window.

360 seconds into the test, the fire in the bedroom reached steady state (post-flashover), ventilation controlled combustion. The door to the target room has burned through with a dramatic increase in temperature as the room fills with smoke.

Suppression using fixed sprinklers and a hoseline began at 525 seconds.

Fire development during this experiment was not particularly remarkable with conditions that could typically be expected in a residential occupancy. So, what can we learn from this test?

Heat Release Rate

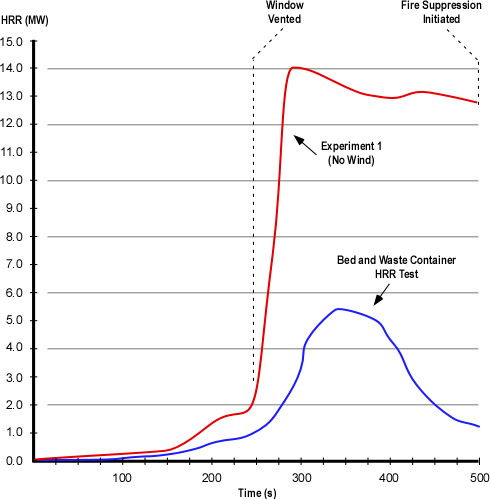
NIST researchers examined the heat release rate of individual fuel packages and combinations of fuel packages prior to the compartment fire tests. These tests conducted in an oxygen consumption calorimeter were performed with the fire in a fuel controlled burning regime. Figure 2 illustrates the heat release rate from the combination of waste container and bed fuel packages and the heat release rate generated during Experiment 1 (in which the initial fuel packages ignited were the waste container and bed located inside the bedroom.

Figure 2. Heat Release Rate Comparison

hrr_comparison

Note: Adapted from Firefighting Tactics Under Wind Driven Conditions.

Questions: Examine the heat release rate curves in Figure 2 and answer the following questions:

  • Why are these two HRR curves different shapes?
  • In each of these two cases, what might have influenced the rate of change (increase or decrease in HRR) and peak HRR?
  • What observations can you make about conditions inside the test structure and heat release rate (in particular, compare the HRR and conditions at approximately 250 and 350 seconds)?

Temperature

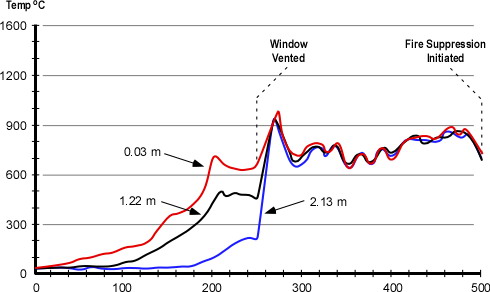
During the experiments temperature was measured in each of the compartments at multiple levels. Figure 3 illustrates temperature conditions in the bedroom at 0.03 m (1″), 1.22 m (4′) and 2.13 m (7′) down from the ceiling during Experiment 1.

Figure 3. Bedroom Temperature

bedroom_temp

Note: Adapted from Firefighting Tactics Under Wind Driven Conditions. Position.

Questions: Examine the temperature curves in Figure 3 and answer the following questions:

  • What can you determine from the temperature curves from ignition until approximately 250 seconds?
  • How does temperature change at approximately 250 seconds? Why did this change occur and how does this relate to the data presented in the HRR curve for Experiment 1 (Figure 2)?
  • What happens to the temperature at the upper, mid, and lower levels after around 275 seconds? Why does this happen?

Total Hydrocarbons

In addition to HRR and temperature, researchers measured gas concentrations inside the compartments at the upper and lower levels. Figure 4 shows the concentration (in % volume) of total hydrocarbons in the bedroom and living room. Concentration of total hydrocarbons is a measure of gas phase fuel (pyrolysis products) in the upper layer.

Figure 4. Total Hydrocarbons at the Upper Level

upper_level_thc

Note: Adapted from Firefighting Tactics Under Wind Driven Conditions. Position.

Questions: Examine the THC curves in Figure 4 and answer the following questions:

  • Why did the THC concentration in the living room rise to a higher level than in the bedroom?
  • Why didn’t the gas phase fuel in the living room burn?
  • How did the concentration of THC in the bedroom reach approximately 4%? Why wasn’t this gas phase fuel consumed by the fire?

The Story Continues…

My next post will address the answers to these questions (please feel free to post your thoughts) and provide an overview of NIST’s initial tests on the use of wind control devices for anti-ventilation.

Ed Hartin, MS, EFO, MIFireE, CFO
Wind Driven Fires

Monday, March 2nd, 2009

Weather, Topography, and Fuel

In S-190 Introduction to Wildland Fire Behavior, firefighters learn that weather, topography, and fuel and the principal factors influencing fire behavior in the wildland environment. How might this important concept apply when dealing with fires in the built environment? Factors influencing compartment fire behavior have a strong parallel to those in the wildland environment. Principal influences on compartment fire behavior include fuel, configuration (of the compartment and building), and ventilation.

Wind Driven Compartment Fires

As buildings are designed to minimize the influence of weather on their contents and occupants, weather is not generally considered a major factor in compartment fires. However, this is not always the case. As wildland firefighters recognize, wind can be a major influence on fire behavior and strong winds present a significant threat of extreme fire behavior.

Under fire conditions, unplanned ventilation involves all changes influencing exhaust of smoke, air intake, and movement of smoke within the building that are not part of the incident action plan. These changes may result from the actions of exiting building occupants, fire effects on the building (e.g., failure of window glass), or a wide range of other factors.

Changes in ventilation can increase fire growth and hot smoke throughout the building. Failure of a window in the fire compartment in the presence of wind conditions can result in a significant and rapid increase in heat release. If this is combined with open doors to corridors, unprotected stairwells, and other compartments, wind driven fire conditions have frequently resulted in firefighter injuries and fatalities (see Additional Reading).

NIST Research on Wind Driven Fires

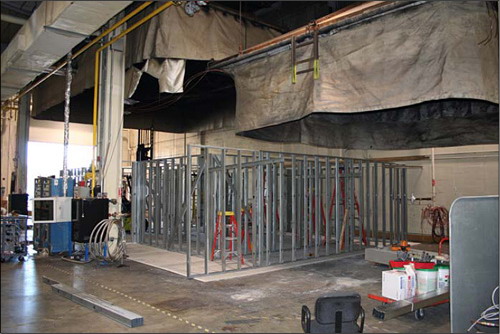
From November 2007 to January 2008, the National Institute of Standards and Technology conducted a series of experiments examining firefighting tactics dealing with wind driven compartment fires. The primary focus of this research was on the dynamics of fire growth and intensity and the influence of ventilation and fire control strategies under wind driven fire conditions. The results of these experiments are presented in Fire Fighting Tactics Under Wind Driven Conditions, published by The Fire Protection Research Foundation.

Tests conducted at NIST’s Large Fire Test Facility (see Figure 1) included establishment of baseline heat release data for the fuels (bed, chairs, sofa, etc), full scale fire tests under varied conditions (e.g., no wind, wind), and experiments involving control of the inlet opening and varied methods of external water application.

Figure 1. NIST Large Fire Test Facility

nist_large_fire_facility

Note: Photo adapted from Firefighting Tactics Under Wind Driven Conditions.

The objectives of this study were:

  • To understand the impact of wind on a structure fire fueled with residential furnishings in terms of temperature, heat flux, heat release rate, and gas concentrations
  • To quantify the impact of several novel firefighting tactics on a wind driven structure fire
  • Improve firefighter safety

After conducting a series of tests to determine the heat release rate characteristics of the fuels to be used for the full scale tests, NIST conducted eight full scale experiments to examine the impact of wind on fire spread through the multi-room test structure (see Figure 2) and examine the influence of anti-ventilation using wind control devices and the impact of external water application.

Multi-Room Test Structure

All tests were conducted under the 9 m (30′) x 12 m (40′) oxygen consumption calorimetry hood at the NIST Large Fire Test Facility. The test structure was comprised of three compartments; Bedroom, Target Room (used to assess tenability in a compartment adjacent to the ventilation flow), and Living Room, along with an interconnecting hallway and exterior hallways. A large mechanical fan was positioned 7.9 m (26′) away from the window in the bedroom of the test structure (see Figure 2) to provide consistent wind conditions for the experiments.

Figure 2. Configuration of the Multi-Room Test Structure

test_floor_plan

Note: Adapted from Firefighting Tactics Under Wind Driven Conditions.

The structure was framed with steel studs and wood truss joist I-beams (TJIs) used to support the ceiling. The interior of the compartments were lined with three layers of 13 mm (1/2″) gypsum board. Multiple layers of gypsum board were used to provide the durability required for repetitive experiments (the inner layer was replaced and repairs made to other layers as needed between experiments).

Used furnishings were purchased from a hotel liquidator to obtain 10 sets of similar furniture to use in the heat release rate and full-scale, multi-compartment experiments. Fuel used in the tests included furniture, nylon carpet, and polyurethane carpet padding (the position major furniture items are illustrated in Figures 2 and 3).  Fuel load was 348.69 kg (768.73 lbs) in the bedroom, 21.5 kg (47.40 lbs) in the hallway, and 217.6 kg (479.73 lbs) in the living room (no contents were placed in the target room).

Figure 3. Bedroom and Living Room Fuel Load

contents

Note: Photos adapted from Firefighting Tactics Under Wind Driven Conditions.

NIST researchers conducted a series of eight full-scale, multi-compartment fire tests. In each case, a fire was started in the Bedroom using a plastic trash container placed next to the bed (see Figure 3).

Figure 3. Placement of the Trash Container

placement_trash_container

Note: Photos adapted from Firefighting Tactics Under Wind Driven Conditions.

Experiments

The eight tests provided the opportunity to study the dynamics of wind driven compartment fires and several different approaches to limiting the influence of air intake and controlling the fire.

Experiment 1: This test was performed to establish baseline conditions with no wind

Experiment 2: Evaluation of anti-ventilation using a large wind control device placed over the window

Experiment 3: Evaluation of anti-ventilation using a large wind control device placed over the window (second test with a longer pre-burn before deployment of the wind control device).

Experiment 4: Evaluation of anti-ventilation and water application using a small wind control device and 30 gpm (113.6 lpm) spray nozzle from under the wind control device.

Experiment 5: Evaluation of anti-ventilation and water application using a small wind control device and 30 gpm (113.6 lpm) spray nozzle from under the wind control device (second test with a lower wind speed)

Experiment 6: No wind control device, application of water using a hoseline equipped with a combination nozzle at 90 psi (621 kPa) nozzle pressure, providing a flow rate of 80 gpm (303 lpm).

Experiment 7: No wind control device, application of water using a hoseline equipped with a 15/16″ smooth bore nozzle at 50 psi (345 kPa) nozzle pressure, providing a flow rate of 160 gpm (606 lpm) (test was conducted with the living room corridor door closed).

Experiment 8: No wind control device, application of water using a hoseline equipped with a 15/16″ smooth bore nozzle at 50 psi (345 kPa) nozzle pressure, providing a flow rate of 160 gpm (606 lpm) (second test with the living room corridor door open).

Note: The nozzles for these tests (100 gpm at 100 psi combination nozzle and 15/16″ solid stream nozzle were selected as to be representative of those used by the fire service in the United States (personal correspondence, S. Kerber, February 28, 2009). However, it is important to note that in comparing the results, that the combination nozzle was under pressurized (80 psi, rather than 100 psi) resulting in large droplet size. In addition, the 100 gpm flow rate was 50% of that applied through the solid stream nozzle and is likely considerably lower than the flow capability of combination nozzles typically used with 1-3/4″ (45 mm) hose.

Important Findings

The first experiment was conducted without any external wind or tactical intervention. The baseline data generated during this test was critical to evaluating the outcome of subsequent experiments and demonstrated a number of concepts that are critical to firefighter safety:

Smoke is fuel. A ventilation limited (fuel rich) condition had developed prior to the failure of the window. Oxygen depleted combustion products containing carbon dioxide, carbon monoxide and unburned hydrocarbons, filled the rooms of the structure. Once the window failed, the fresh air provided the oxygen needed to sustain the transition through flashover, which caused a significant increase in heat release rate.

Venting does not always equal cooling. In this experiment, post ventilation temperatures and heat fluxes all increased, due to the ventilation induced flashover.

As discussed in early posts, Fuel & Ventilation and Myth of the Self Vented Fire understanding the relationship between oxygen and heat release rate, the hazards presented by ventilation controlled fires, and the influence of ventilation on fire development is critical to safe and effective fireground operations.

Fire induced flows. Velocities within the structure exceeded 5 m/s (11 mph), just due to the fire growth and the flow path that was set-up between the window opening and the corridor vent.

Avoid the flow path. The directional nature of the fire gas flow was demonstrated with thermal conditions, both temperature and heat flux, which were twice as high in the “flow” portion of the corridor as opposed to the “static” portion of the corridor in Experiment 1 [not wind driven]. Thermal conditions in the flow path were not consistent with firefighter survival.

Previous posts have presented case studies based on incidents in Loudoun County Virginia and Grove City, Pennsylvania in which convective flow was a significant factor rapid fire progress that entrapped and injured firefighters, in one case fatally. Previous NIST research investigating a multiple line-of-duty death that occurred in a townhouse fire at 3146 Cherry Road in Washington, DC in 1999 also emphasized the influence of flow path on fire conditions and tenability.

More to Follow

Subsequent posts will examine the NIST wind driven fire tests in greater detail.

Ed Hartin, MS, EFO, MIFireE, CFO

References

Madrzykowski, D. & Kerber, S. (2009). Fire Fighting Tactics Under Wind Driven Conditions. Retrieved (in four parts) February 28, 2009 from http://www.nfpa.org/assets/files//PDF/Research/Wind_Driven_Report_Part1.pdf; http://www.nfpa.org/assets/files//PDF/Research/Wind_Driven_Report_Part2.pdf;http://www.nfpa.org/assets/files//PDF/Research/Wind_Driven_Report_Part3.pdf;http://www.nfpa.org/assets/files//PDF/Research/Wind_Driven_Report_Part4.pdf.

Madrzykowski, D. & Vettori, R. (2000). Simulation of the Dynamics of the Fire at 3146 Cherry Road NE, Washington D.C., May 30, 1999. Retrieved March 1, 2009 from http://fire.nist.gov/CDPUBS/NISTIR_6510/6510c.pdf

Additional Reading

The following investigative reports deal with firefighter line of duty deaths involving wind driven fire events during structural firefighting.

National Institute for Occupational Safety and Health (NIOSH). (1999). Death in the line of duty, Report F99-01. Retrieved February 28, 2009 from http://www.cdc.gov/niosh/fire/pdfs/face9901.pdf

National Institute for Occupational Safety and Health (NIOSH). (1999). Death in the line of duty, Report F98-26. Retrieved February 28, 2009 from http://www.cdc.gov/niosh/fire/pdfs/face9826.pdf

National Institute for Occupational Safety and Health (NIOSH). (2002). Death in the line of duty, Report F2001-33. Retrieved February 28, 2009 from http://www.cdc.gov/niosh/fire/pdfs/face200133.pdf

National Institute for Occupational Safety and Health (NIOSH). (2007). Death in the line of duty, Report F2005-03. Retrieved February 28, 2009 from http://www.cdc.gov/niosh/fire/pdfs/face200503.pdf

National Institute for Occupational Safety and Health (NIOSH). (2008). Death in the line of duty, Report F2007-12. Retrieved February 28, 2009 from http://www.cdc.gov/niosh/fire/pdfs/face200712.pdf

Prince William County Department of Fire and Rescue (2007). Line of duty investigative report: Technician I Kyle Wilson. Retrieved February 28, 2009 from http://www.pwcgov.org/default.aspx?topic=040061002930004566

Texas State Fire Marshal’s Office. (2001). Firefighter Fatality Investigation, Investigation Number 02-50-10. Retrieved February 28, 2009 from http://www.tdi.state.tx.us/reports/fire/documents/fmloddjahnke.pdf