Archive for the ‘B-SAHF Exercises’ Category

Reading the Fire:
Putting it all Together

Thursday, September 17th, 2009

The first post in this series, Reading the Fire: How to Improve Your Skills, I discussed building a concept map of fire behavior indicators as a method to increase competence in reading the fire. In the 12 posts that followed, we have explored each of the categories of the B-SHAF organizing scheme by developing a concept map for each type of indicator.

I have been working through this process as well in an effort to expand and refine my personal B-SAHF concept map. This post will review the work accomplished so far and lay the foundation for moving to the next step in the process; applying B-SAHF to recognize key indicators and predict likely fire behavior.

This review will be graphic, using the current version (5.2.2.1) of each of the concept maps developed in this series of posts.

Building Factors

Unlike the other elements of the B-SAHF organizing scheme for fire behavior indicators, Building Factors are present before the fire. Frank Brannigan was fond of saying “the building is the enemy” (Brannigan & Corbett, 2008, p. 81). The term enemy (2009) can be used to describe one who is antagonistic or seeking to injure or harm another. In this sense the building is not our enemy as it has no intent. However, it may also be used to describe something that is potentially harmful (Enemy, 2009). From this perspective Frank could be correct. However, I find that in the use of warfare as a metaphor for firefighting, I find it more useful to consider the building as the terrain that we fight on, rather than the enemy.

Building factors (such as use of lightweight or engineered wood support systems) present a significant hazard, but only under fire conditions. Fire dynamics and building performance under fire conditions are interrelated and should be key considerations in the pre-planning process.

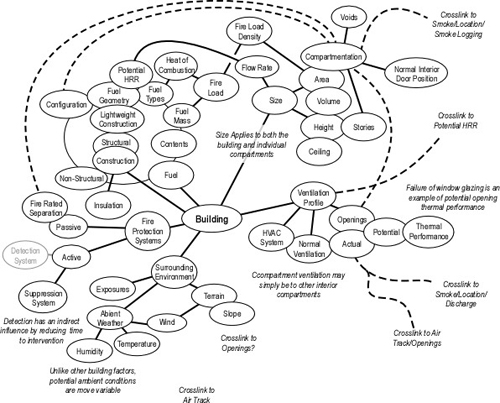
In many respects, Building Factors is the most complex category of the fire behavior indicators. Figure 1 illustrates my current concept map capturing many (but likely not all) of the key building factors that influence fire behavior.

Figure 1. Building Factors
building_factors_5-2-2-1

Consider what other building factors might be of interest or concern as well as how these factors may be interrelated with the other elements of the B-SAHF scheme.

Smoke Indicators

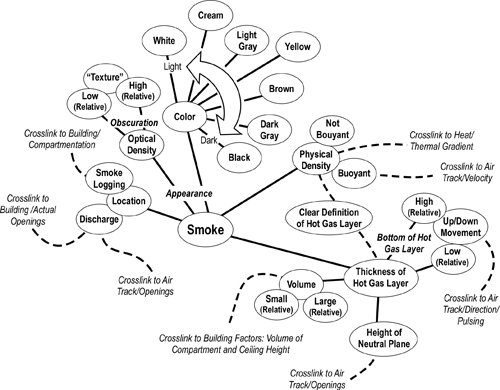
There are a significant number of interrelationships between smoke indicators and the other elements of the B-SAHF model, particularly Building Factors, Air Track, and Heat. These relationships reinforce the importance of looking at fire behavior indicators holistically, rather than simply as individual elements.

Figure 2. Smoke Indicators
smoke_indicators_5-2-2-1

Are there other indicators related to smoke that may be useful in identifying or assessing the stage of fire development, burning regime, or other important aspects of fire behavior? What additional interrelationships exist with the other elements of B-SAHF?

Air Track Indicators

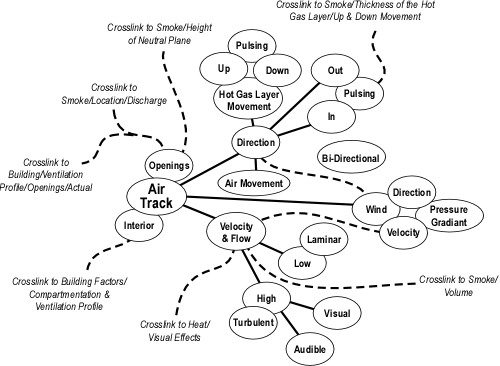
Air track is the movement of both smoke (generally out from the fire area) and air (generally in towards the fire area). Air track is caused by pressure differentials inside and outside the compartment and by gravity current (differences in density between the hot smoke and cooler air). Air track indicators include velocity, turbulence, direction, and movement of the hot gas layer. As in the case of smoke, air track is closely interrelated with Building Factors, Smoke, and Heat Indicators.

Figure 3. Air Track Indicators
air_track_indicators_5-2-2-1

Are there other air track indicators that might be useful in assessing conditions and making predictions about likely fire behavior? What other interrelationships exist between air track and the other elements of B-SAHF?

Heat Indicators

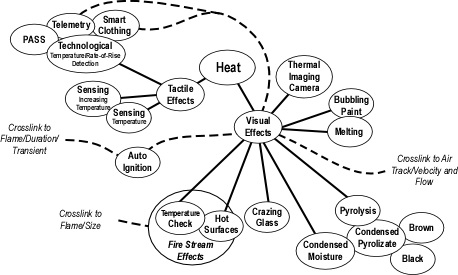
In considering heat indicators, it is important to distinguish between energy, temperature, and heat. While this category is titled heat indicators, much of what we observe and feel is based on increased temperature due to transfer of energy (energy in transit is heat). To review the discussion of energy, temperature and heat, see Reading the Fire: Heat Indicators.

Figure 4. Heat Indicators
heat_indicators_5-2-2-1

What other heat indicators may be useful in assessing conditions, the risk to firefighters, and impact of tactical operations on fire behavior? Are there additional interrelationships with other elements of B-SAHF?

Flame Indicators

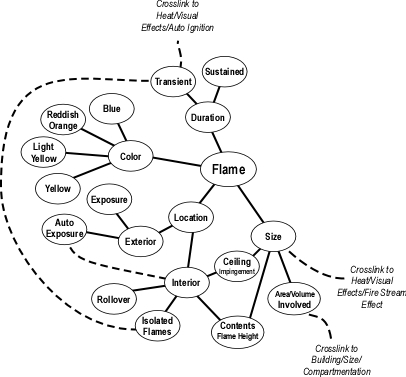
Flames are the visible, light emitting product of combustion. In compartment fires, flames are the result of glowing particulate material (predominantly carbon). While extremely useful, information from flame indicators must be considered in conjunction with the other elements of B-SAHF.

Figure 5. Flame Indicators
flame_indicators_5-2-2-1

Are there other flame related indicators that might be useful? Are there additional interrelationships with other elements of B-SAHF?

Applying B-SAHF

Developing your skill in reading the fire requires ongoing deliberate practice. What does this look like? In the following video clip, Tiger Woods is described as “just a pro who wants his game to get better, every day”

Are we professionals who want our skill at reading the fire to get better, every day? What does will it take for us to accomplish this task? It takes more than just talking about it or attending a class. Developing this level of skill requires ongoing, deliberate practice. Building a concept map of the B-SAHF indicators is an early step in this process as it gives you a way to think about information provided by the building and fire that will allow you to recognize important conditions and what is likely to happen next. Developing this understanding is necessary, but not sufficient. You also need to work on your skill at recognition and developing the ability to interpret this information in the context of the situation.

Using video is a great way to practice your skill in recognizing key indicators. On the fireground, you may only see a particular indicator for a few seconds. There is no instant replay. However, with video you can watch a particular clip again and again to practice your skill and develop the ability to separate critical indicators from the noise of extraneous information.

Practice Your Craft!

Reading the fire and recognizing likely and potential fire development is a critical part of initial size-up and action planning. However, this process needs to continue throughout incident operations as you evaluate the impact of tactical operations (the responsibility of everyone on the fireground, not just officers or the incident commander). Use the following two video clips of tactical operations to practice your skill (and maybe discover a few additional indicators to add to your B-SAHF concept maps).

Video Clip1-Roof Operations: Watch this video clip of vertical ventilation operations and identify the key B-SAHF Indicators. What information do the building, smoke, air track, heat, and flame indicators provide about current conditions? How is fire behavior likely to change?

Video Clip 2-Fire Attack: Watch this video clip of initial attack operations at a commercial fire. What building, smoke, air track, heat, and flame indicators can you observe in this clip? What information do these indicators provide? How do the indicators change based on application of water? What can you determine based these changes?

More to Follow

The next post in this series will begin to examine application of the B-SAHF scheme to recognizing stages of fire development and burning regime as part of initial and ongoing size-up and situation assessment.

Master Your Craft

Ed Hartin, MS, EFO, MIFireE, CFO

References

Brannigan, F. & Corbett, G. (2008). Building construction for the fire service. Sudbury, MA: Jones & Bartlett.

Enemy. (2009). In Merriam-Webster Online Dictionary. Retrieved September 17, 2009, from http://www.merriam-webster.com/dictionary/enemy

Reading the Fire: Flame Indicators Part 2

Thursday, September 10th, 2009

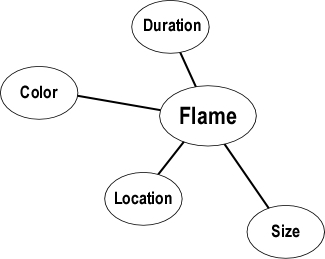
The previous post in this series, Reading the Fire: Flame Indicators briefly looked at flames, the visible, light-emitting product of combustion and identified several basic categories of flame related fire behavior indicators as illustrated in Figure 1.

Figure 1. Basic Flame Indicators

flame_indicators_5-2-2

As with each of the B-SAHF (building, smoke, air track, heat, and flame) indicators, it is essential that assessment of flame related indicators is integrated with other elements of the B-SAHF scheme to gain a clearer sense of fire conditions and likely fire behavior.

Size and Location

Location of the flames may provide important information. If flames are visible from outside the structure, where are they coming from? It is important to connect this information with building factors such as compartmentation. Is fire showing from a single window due to compartmentation or simply because that is the only window that has failed? Are the flames pushing from inside a compartment or is smoke igniting and burning outside?

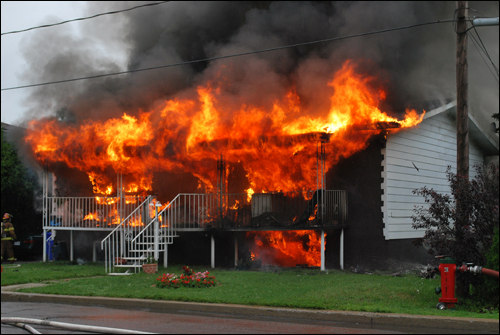
Given the conditions depicted in Figure 2, the size and location of flames make it obvious that the fire involves multiple compartments of this single family dwelling. However, it is important not to be distracted or deceived by conditions observed from one location!

Figure 2. Fire Showing from a Single Family Dwelling

gatineau_fire

Note: Photo by Marc Caron, Gatineau, Québec Canada

Early on the morning of July 21, 2007; Contra Costa County Engine 70 responded to a residential fire with persons reported at 149 Michelle Drive. On arrival, Engine 70 observed fire showing from the door and large picture window on Side A. From this limited view of the building, the fire appeared to be in the living room with potential for trapped occupants in the bedrooms. Engine 70 went to work knocking down the fire from the doorway and initiating a primary search of the bedrooms. However, conditions were not as simple as they seemed. The fire, which had originated in one of the bedrooms on Side B was burning in a ventilation controlled state with a substantial accumulation of gas phase fuel in the bedrooms and hallway. As Engine 70 conducted their search, increased ventilation returned the fire to flaming combustion, igniting the gas phase fuel (smoke) in a flash fire that killed Captain Matthew Burton and Engineer Scott Desmond (for more information on this incident see: Contra Costa LODD, Contra Costa LODD: Part 2, Contra Costa LODD: What Happened?).

It is absolutely critical that observation of flames be integrated with all of the B-SAHF indicators from more than one perspective. The first arriving officer should conduct a 360o reconnaissance whenever possible. However, this is not always possible. If the first arriving company cannot accomplish this task, it does not diminish the importance of determining conditions on other sides of the building and another company should be assigned to complete this task as soon as possible.

While working inside the building, what is the flame height? Are the flames impinging on the ceiling and bending to travel horizontally? Do you observe flames in the hot gas layer (i.e., ghosting, rollover)? Fire development speeds considerably after flames in the plume of hot gases reach the ceiling and begin to travel horizontally in the ceiling jet. Isolated flames in the hot gas layer are a strong indicator of a ventilation controlled fire. Flames in the hot gas layer or development of rollover are an important indicator of imminent flashover.

With flame indicators, it is not just what you see that is important. What you do not see is equally important. Remember that the low oxygen concentration in backdraft conditions may preclude flaming combustion (at least in that compartment). However, conditions can vary widely from compartment to compartment (void spaces are compartments too!) and you may have visible flames from the exterior, but quite different conditions inside the building.

As with other fire behavior indicators, change over time is an important indication of fire development or progress towards control. This is particularly true with flaming combustion. Once fire control operations have started, firefighters and fire officers must evaluate the effect of fire streams. Failure of water application to reduce the size of the fire indicates that either the flow rate is inadequate, the application point is ineffective, or both.

Flame Color

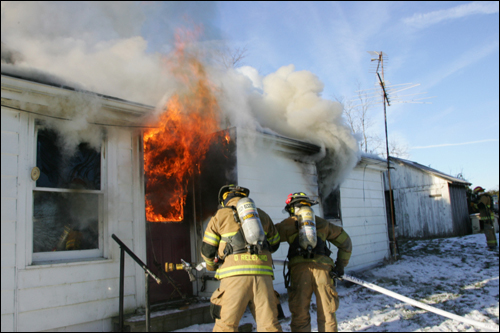
Flame color is largely dependent on the type of fuel involved and the extent to which the fuel and oxygen are mixed (see the previous post Reading the Fire: Flame Indicators, Figure 2-Diffusion and Premixed Flames). Because there are several influences on flame color, it is important to interpret this information in context with other fire behavior indicators. Organic materials (natural or synthetic) will tend to burn with light yellow to reddish orange color depending on oxygen concentration as illustrated in Figure 3.

Figure 3. Fire Showing

flame_color_door

Note: Photo courtesy of Mercer County Fire Protection District

While flame color can often be observed from the exterior as illustrated in Figure 3, it is also important while working inside as observed by Captain James Mendoza of the San Jose Fire Department.

The coloration of diffusion flames commonly encountered in structure fires runs from red to orange to yellow to almost white. This scale tells you something about the energy of the fire, with the redder the flame, the less temperature and radiant heat it is releasing. Often the lower energy red flames are due to combustion occurring with limited air, and if ventilation is increased, the energy released increases, temperature increases, and color changes from red to orange to yellow to white. So, if you are feeling extreme heat as you move towards dark orange flames, realize the air you just let in by opening the door can make the conditions worse, and you may be able to see that visually by a lighter flame color.

If organic fuel gas or vapor is premixed with air, flame color will be bluish. In compartment fires, a lazy bluish flame moving through the hot gas layer is an indication of a substantially ventilation controlled fire. However, it is important to remember that flame contact with other materials may influence color. For example, flame impinging on copper will have a blue green color.

Less commonly encountered in compartment fires, a bright white flame is usually indicative of high temperature such as that generated by burning metal (i.e., magnesium).

Duration

Given adequate fuel and oxygen, flaming combustion is likely to be continuous. However, when a compartment fire is burning in a ventilation controlled regime, flames may be intermittent as fuel and oxygen concentration varies. Watch the following video and observe the difference in flaming combustion from the window on Side B in the first 45 seconds (0:00 to 0:45) and from the window on Side A the next 30 seconds (00:46 to 1:16). How are the flames different? Why do you think that this is the case?

Work in Progress

Hopefully we have been working on this project together and you have been developing or refining the flame segment of your fire behavior indicators concept map. My current map is illustrated in Figure 4.

Figure 4. Flame Indicators Concept Map v5.2.2.1

flame_indicators_5-2-2-1

You can also download a printer friendly version of the Flame Indicators Concept Map v5.2.2.1 As always, should you have any suggestions or feedback, please post a comment!

Ed Hartin, MS, EFO, MIFireE, CFO

Reading the Fire: Flame Indicators

Thursday, September 3rd, 2009

In Reading the Fire: How to Improve Your Skills, I discussed building a concept map of fire behavior indicators as a method to increase competence in reading the fire. Construction of a concept map increases awareness of key indicators and understanding their interrelationships. I am working through this process along with you, with the latest revision to my concept map. Thus far, I have examined Building Factors, Smoke Indicators, Air Track, and Heat Indicators the first fourcategories in the B-SAHF (Building, Smoke, Air Track, Heat, and Flame) organizing scheme. For review of the discussion of the work done so far, see the following Reading the Fire posts:

Focus Question

The process of developing or refining a concept map identifying fire behavior indicators (FBI) and their interrelationships starts with the following focus question:

What building, smoke, air track, heat, and flame indicators
provide clues to current and potential fire behavior?

As you develop the flame indicators concept map it is likely that you will uncover potential additions to the Building Factors, Smoke, Air Track or Heat Indicators concept maps. You may also identify interrelationships that you may not have thought of previously. Don’t forget to go back and capture these thoughts by adding them to your other maps or placing them in a staging area for further consideration.

Caution!

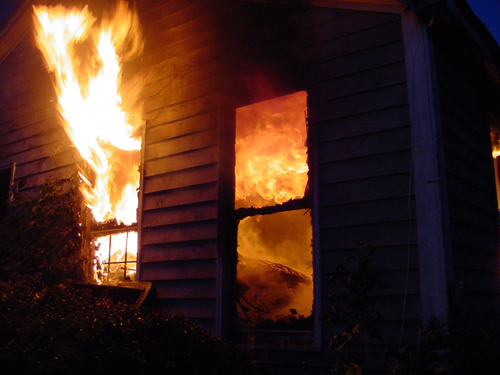
Flames get quite a bit of attention. Flames showing are sure to increase a firefighter’s pulse.

Figure 1. Flame Showing!

flame_showing

Note: Photo by Captain Jacob Brod, Pineville-Morrow Volunteer Fire Department

It is important to remember that while flames are an important fire behavior indicator, they provide only part of the picture. There is also a reason why they are last in the B-SAHF organizing scheme. Flame indicators must be integrated with Building, Smoke, Air Track, and Heat indicators to gain a more complete picture of incident conditions.

Flames

Flames are the visible, light emitting product of combustion. In compartment fires, flames are the result of glowing particulate material (predominantly carbon).

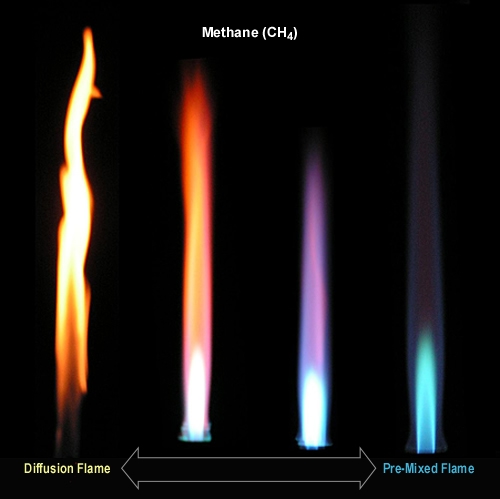
There are several distinctly different types of flames. Pre-mixed flames result when fuel vapor is mixed prior to combustion. The flame from a gas stove or heating appliance would be a good example of a pre-mixed flame. However, most of the flames encountered in a compartment fire are diffusion flames. In a diffusion flame, fuel defuses in the air to form a reaction zone containing fuel, air, and heat in the correct proportion to support combustion. Diffusion flames result from less efficient combustion (resulting in the presence of an increased percentage of unburned particulate material). The difference in appearance of pre-mixed and diffusion flames is illustrated in Figure 2.

Figure 2. Diffusion and Pre-Mixed Flames

bunsen_burner

Note: Each of these flames is being produced by the same fuel (Methane, CH4). The difference in appearance results from where the fuel and oxygen are mixed and the resulting efficiency of combustion.

Getting Started

Firefighters’ attention is often drawn to flames like a moth to a candle. However, this is only one of many fire behavior indicators. Visible flames may provide an indication of the size of the fire (i.e., fire showing from one window vs. fire showing from all windows on the floor). The size or extent of the fire may also be indicated by the effect (or lack of effect) of fire streams on flaming combustion.

As always in developing a concept map it is important to move from general concepts to those that are more specific. Flame Indicators can be divided into several categories as illustrated in Figure 3. However, you may choose to approach this somewhat differently.

Figure 3. Basic Flame Indicators

flame_indicators_5-2-2

Developing the Detail

Expanding the map requires identification of additional detail for each of the fundamental concepts. If an idea appears to be obviously related to one of the concepts already on the map, go ahead and add it. If you are unsure of where it might go, but it seems important, list it off to the side in a staging area for possible additions. Download a printer friendly version of Flame Indicators to use as a starting point for this process.

Next Steps

Remember that the process of contracting your own map is likely as important as the (never quite) finished product. The following steps may help you expand and refine the flame indicators segment of the map:

  • Look at each of the subcategories individually and brainstorm additional detail. This works best if you collaborate with others.
  • Have a look at the following video clip using your partially completed map and notes as a guide to identifying important flame indicators. While this video clip is of conditions on the exterior, also think about how this fire would present if viewed from the interior.

The next post in this series will discuss flame indicators in greater depth.

Ed Hartin, MS, EFO, MIFireE, CFO

Reading the Fire:
Heat Part 3

Thursday, August 27th, 2009

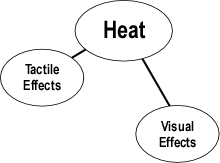
Reading the Fire Heat Indicators briefly examined energy, temperature, and heat in thermodynamic systems, and introduced the two major categories of heat related fire behavior indicators: those that we can see (visual) and others that can be felt (tactile) as illustrated in Figure 1.

Figure 1. Basic Heat Indicator Categories

heat_indicators_5-2-2

Heat Indicators Part 2 elaborated on tactile effects. This post will examine visual effects and provide an expanded heat indicators concept map.

Remember that as with each of the B-SAHF (building, smoke, air track, heat, and flame) indicators; it is essential that assessment of heat is integrated with other elements of the B-SAHF scheme to gain a clearer sense of fire conditions and likely fire behavior.

Visual Effects

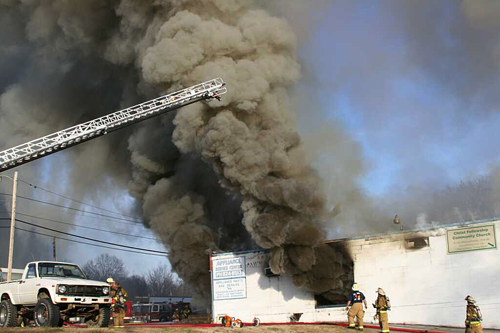
Air track often provides an early heat indicator. Observation of turbulent smoke pushing from the building at high velocity is a reliable indicator of a tremendous amount of heat energy and high temperatures inside the structure.

Figure 2. Air Track as a Heat Indicator

ranlo_c-fire_2

Note: Photo by Terry Moody, Ranlo NC.

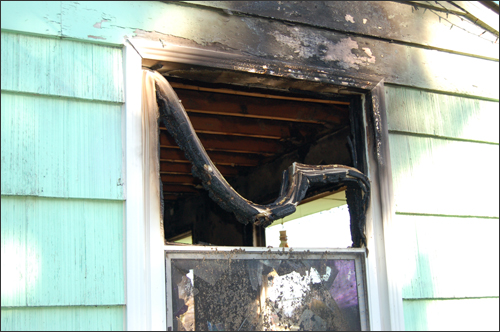
Some visual indicators can be observed from the exterior such as bubbling paint, melting or softening roofing material, crazing glass, and condensation of pyrolyzate on windows. High temperature (and in some cases, not so high temperature) can have a more dramatic effect (see Figure 3). This vinyl frame window failed due to heat resulting from a fully developed fire inside the compartment.

Figure 3. Temperature Effects on Building Materials

temp_effects_window

Note: Photo by Ed Hartin

Fire stream effects such as evaporation of water from a hot surface (such as a door) or lack of return from a temperature check (brief application of water fog into the hot gas layer to check overhead temperature) also provide an indication of temperature (Figure 4)

Figure 4. Checking the Door and Temperature Check

door_and_temp

Note: Photo by John McDonough

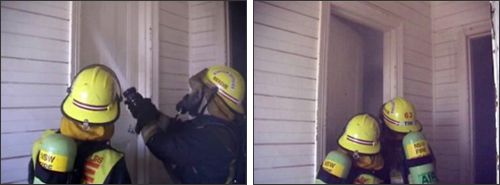
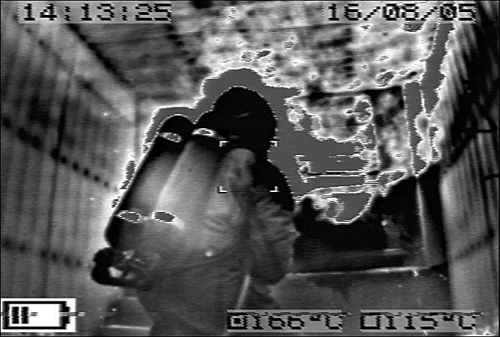
A thermal imaging camera (TIC) provides a highly effective means for visualizing temperature differences (see Figure 5). Use of a TIC should begin on the exterior and continue during interior operations.

Figure 5. Thermal Image

thermal_image

Note: Photo provided by Stefan Svensson

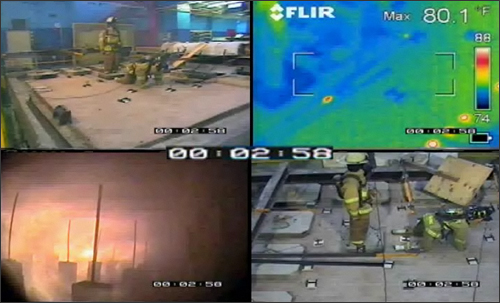
Despite the tremendous advantage provided by use of a TIC, it is essential to be mindful of the limitations of this technology. Thermal images only identify the temperature differences that are in direct line-of-sight. Insulating materials such as compartment linings can prevent the TIC from identifying fire conditions outside the compartment (e.g., floor below, ceiling void). In tests of floor and roof assemblies conducted by the Underwriters Laboratory (UL), thermal imaging cameras were unable to detect a fully developed fire below a typical wood floor (see Figure 6). The floor in Figure 6 consisted of an engineered system of I-joists, sub-floor, finished floor, carpet padding, and carpet. The floor system was being tested over a 14′ x 17′ (4.27 m x 5.18 m) gas fired furnace in accordance with ASTM E119. While the temperature indicated by the TIC is 80.1o F (27o C), the highest temperature measured by thermocouples on the structural members was in excess of 1341o F (727o C). It is essential to integrate thermal image data with direct visual observations to obtain a more complete picture of temperature conditions.

Figure 6. UL Floor Systems Test

i-joist_quadview

Adapted from Underwriters Laboratory Structural Stability of Engineered Lumber in Fire Conditions [on-line training program]

The tests of engineered lumber systems and training program developed by UL provide excellent information on performance of these structural materials under fire conditions. This program as well as on-line training on fire behavior in single family dwellings and fire modeling are available free of charge from UL University.

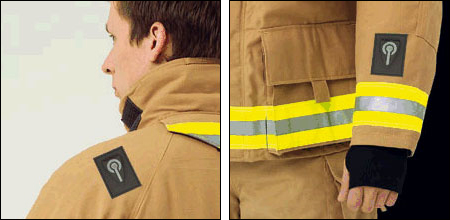
Technological advancements also include temperature sensing integrated into breathing apparatus, personal alert safety systems (PASS), and even protective clothing (see Figure 7) to assist firefighters in recognizing dangerous elevated temperatures and in some cases telemetry to transmit this information to others, outside the hazardous environment. This could be viewed as a visual indicator (based on visual display of the information) or as augmentation of tactile indicators.

Figure 7. Smart Clothing by Viking Industries

viking_thermal_sensor

Work in Progress

Hopefully we have been working on this project together and you have been developing or refining the air track segment of your fire behavior indicators concept map. My current map is illustrated in Figure 8.

Figure 8. Heat Indicators Concept Map v5.2.2.1

heat_indicators_5-2-2-1

You can also download a printer friendly version of the Heat Indicators Concept Map v5.2.2.1 As always, should you have any suggestions or feedback, please post a comment!

Ed Hartin, MS, EFO, MIFireE, CFO

References

Underwriters Laboratory. (2009). Structural Stability of Engineered Lumber in Fire Conditions [on-line training program]. Retrieved August 27, 2009 from http://www.ul.com/global/eng/pages/offerings/industries/buildingmaterials/fire/courses/structural/

Reading the Fire 9

Monday, August 24th, 2009

As discussed in prior Reading the Fire posts and the ongoing series examining fire behavior indicators (FBI) using the B-SAHF (Building, Smoke, Air Track, Heat, and Flame) organizing scheme, developing proficiency requires practice. This post provides an opportunity to exercise your skills using three video segments shot during a commercial fire. In addition to practicing your skill in reading the fire, use these video clips to help develop or refine your smoke indicators concept map (see Reading the Fire: Smoke Indicators).

Commercial Fire

The Lake Station (IN) Fire Department was dispatched to a reported structure fire in the vicinity of the American Legion Hall on Central Avenue. Responding companies found a commercial building with fire and smoke showing at the intersection of Central Avenue and Howard Street.

Download and the B-SAHF Worksheet.

While the video clip of this incident does not allow you to walk around the building and observe fire conditions, Google maps street view allows you to view all sides of the building. If you haven’t used street view, have a look at the following Google Street View Tutorial.

Perform a “walkaround” by clicking on the following link to view the building involved at this incident: 1691 Central Ave, Lake Station, IN. Note: Radio communication in the video clip identifies the Incident Commander as “Howard Command”. However, for this activity, I have identified Central Avenue as the A Side of the involved building. Click on the arrows to move east on Central Avenue and move and adjust the compass rose to look at Side D. Move back along Central Avenue and then go down Howard Street, again adjusting the compass rose to look at Sides B and C. After your “walk around”, complete the Building Factors segment of the B-SAHF Worksheet.

The video clip of this incident begins with the view of Side B from the A/B Corner prior to the arrival of the first engine company. Watch the first 60 seconds of Video Segment 1. Consider the information provided in this segment of the video clip. First, describe what you observe in terms of the Building (add to what you have done so far), Smoke, Air Track, Heat, and Flame Indicators and then answer the following five standard questions:

  1. What additional information would you like to have? How could you obtain it?
  2. What stage(s) of development is the fire likely to be in (incipient, growth, fully developed, or decay)?
  3. What burning regime is the fire in (fuel controlled or ventilation controlled)?
  4. What conditions would you expect to find inside this building?
  5. How would you expect the fire to develop over the next two to three minutes?

Watch the next three minutes of the video and identify if, and how conditions change from the beginning of the clip until the first line is placed in operation (at approximately 04:00).

Watch the next 2 minutes 30 seconds until the firefighters make entry through the door on Side A (at approximately 06:30).

  1. What conditions would you expect to find inside this part of the building?
  2. How would you expect the fire to develop over the next two to three minutes?

Watch the remainder of the video clip.

Important: While not related to Reading the Fire, you likely heard the Personal Alert Safety System (PASS) device sounding through much of the incident. While PASS devices can (and often are) accidentally activated, continuous sounding of a PASS indicates a firefighter in distress. While this was not the case in this incident, failure to silence PASS devices that are accidentally activated desensitizes firefighters to this important audible signal.

Remember the Past

August 1994 saw the loss of two company officers and a firefighter in three separate incidents involving extreme fire behavior. Rapidly changing fire conditions are a threat to firefighters working in career staffed, urban fire departments and volunteer departments serving small communities.

August 7, 1994
Captain Wayne Smith
Fire Department of the City of New York, New York

On August 7, Captain Wayne Smith of the New York City Fire Department was critically injured while conducting search and rescue operations on an upper floor of a building when he was trapped by high heat and heavy smoke conditions. Captain Smith was burned over 40 percent of his body and received severe smoke inhalation injuries to his lungs. He died on October 4 from his injuries. Fourteen other firefighters were injured in the blaze. Initial operations were hampered by a faulty fire hydrant across the street from the building.

August 8, 1994
Sergeant Craig Drury
Highview Fire District, Kentucky

On August 8, Sergeant Craig Drury of the Highview (KY) Fire District was caught in a flashover while making entry into a single story house. Sgt. Drury suffered severe burns to his lungs that eventually caused his death. The fire was started by an arsonist.

August 27, 1994
Firefighter Paul MacMurray
Hudson Falls Volunteer Fire Department, New York

On August 27, Firefighter Paul MacMurray of the Hudson Falls (NY) Volunteer Fire Department responded as part of an engine company to a fire on the first floor of in a three story hotel. Assigned to search for and rescue occupants on the second floor, MacMurray and another firefighter successfully evacuated several victims while attempts to extinguish the fire were initiated below them. Upon their return to continue the search, conditions quickly changed from a light haze of smoke to black smoke with high heat conditions. MacMurray and his partner became separated in their attempt to locate the stairwell and get out of the building. The other firefighter made several efforts to locate MacMurray, but was forced to retreat due to untenable conditions. Several rescue efforts were made but heavy fire conditions eventually forced the evacuation of all fire personnel to defensive positions as the entire structure burned. MacMurray’s body was recovered the following day. The fire was of incendiary origin.

Ed Hartin, MS, EFO, MIFIreE, CFO

Reading the Fire:
Heat Indicators Part 2

Thursday, August 20th, 2009

Reading the Fire Heat Indicators briefly examined energy, temperature, and heat in thermodynamic systems, and introduced the two major categories of heat related fire behavior indicators: those that we can see (visual) and others that can be felt (tactile) as illustrated in Figure 1.

Figure 1. Basic Heat Indicator Categories

heat_indicators_5-2-2

As with each of the B-SAHF (building, smoke, air track, heat, and flame) indicators, it is essential that assessment of heat is integrated with other elements of the B-SAHF scheme to gain a clearer sense of fire conditions and likely fire behavior.

The Thermal Environment

The thermal environment that firefighters encounter can be complex, but involves one or more of the following scenarios (Bryner, Madrzykowski, & Stroup, 2005):

  • Immersion in a relatively static layer of hot gases (i.e., crawling or crouching in a room full of hot combustion products and smoke)
  • Contact with a moving layer of hot gases (i.e., entry through a door or moving down a hallway with a strong air track)
  • Exposure to radiant heat (i.e., working in proximity to flames or below a layer of hot gases)

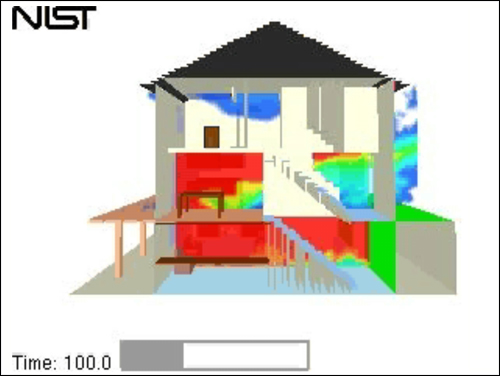
Figure 2 illustrates the variations in temperature that firefighters may encounter during operations in a highly compartmentalized, multi-level structure. It is important to note that temperature varies from compartment to compartment and at different levels within each compartment.

Figure 2. Smokeview Slice

smokeview_temp_slice

Note: Adapted from National Institute of Standards and Technology (NIST) Visualization techniques, Slice animation of a townhouse kitchen fire.

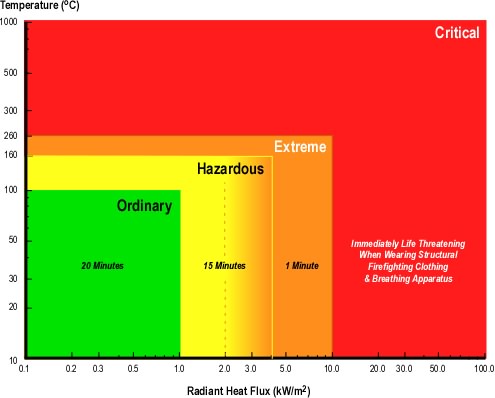
Firefighters’ personal protective equipment insulates them from the thermal environment. This layer of insulation makes it difficult to accurately assess temperature and heat flux (amount of heat transfer) that they are exposed to during firefighting operations. The thermal insulation provided by personal protective equipment slows, but does not stop heat transfer from the fire environment to the firefighter. Thermal exposure is dependent on gas temperature and radiant heat flux (heat transfer due to radiation)./

Thermal exposure can be divided into four categories: Ordinary, Hazardous, Extreme, and Critical (Foster & Roberts, 1995; Donnelly, Davis, Lawson, J., Selpak, 2006). As illustrated in Figure 3.

Figure 3. Thermal Exposure Limits in the Firefighting Environment

thermal_environment

Note: Adapted from Measurements of the firefighting environment. Central Fire Brigades Advisory Council Research Report 61/1994 by J.A. Foster & G.V. Roberts, 1995. London: Department for Communities and Local Government and Thermal Environment for Electronic Equipment Used by First Responders by M.K. Donnelly, W.D. Davis, J.R. Lawson, & M.J. Selepak, 2006, Gaithersburg, MD: National Institute of Standards and Technology.

Several challenges confront firefighters in assessing the thermal environment during firefighting operations. These include:

  • Of necessity, firefighters are insulated from their environment, delaying tactile perception of changes in temperature and heat flux.
  • Perception of temperature is influenced by a wide range of factors and varies considerably from individual to individual.
  • Firefighters focused on the task at hand may not notice subtle changes in temperature and heat flux.
  • Temperature and heat flux do not always present obvious visual indicators.
  • Conditions can change extremely rapidly, particularly as the fire approaches flashover.
  • Firefighters may ignore warning signs of worsening conditions, believing that it is part of the job to tolerate extreme conditions.

Firefighters must have a sound understanding of the thermal environment encountered during firefighting operations and the, at times, subtle indicators of changing thermal conditions.

Tactile Effects

Tactile effects include sensing temperature or temperature change. Firefighters may sense temperature and changes in temperature, but as noted earlier, this is limited by the extent of thermal protection provided by their protective clothing and focus on the task at hand. Firefighters’ protective clothing effectively insulates them from the thermal hazards typically encountered in firefighting. The multiple layers of insulation in the protective ensemble slows (but does not stop) heat transfer. This time lag makes it difficult for the firefighter to appreciate their thermal exposure (Bryner, Madrzykowski, & Stroup, 2005).

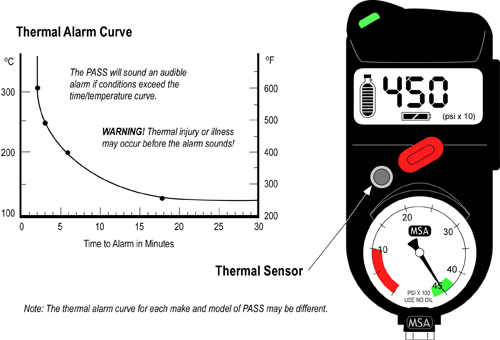
Firefighter’s personal alert safety system (PASS) devices may be equipped with a temperature sensing function that provides warning at a specified exposure value when the specified temperature is exceeded for a specified time period (Figure 4). However, National Fire Protection Association 1982 Standard on Personal Alert Safety Systems (PASS) (NFPA, 2007) does not address thermal sensing and there is not standardized test protocol for these types of devices (Bryner, Madrzykowski, & Stroup, 2005). Thermal sensing devices use a temperature response curve to provide warning for long duration exposure to lower temperature and short duration exposure to higher temperature. However, during rapid increases in temperature such as those encountered in flashover or other forms of rapid fire development, adequate early warning to permit egress is unlikely due to limited sensitivity of the sensors (Bryner, Madrzykowski, & Stroup, 2005). While firefighters must be attentive to heat level and temperature change, it is often difficult to perceive these changes quickly enough to react to rapidly developing fire conditions. This reinforces the importance of integrating all the fire behavior indicators in your ongoing size-up and dynamic risk assessment.

Figure 4. PASS Device Temperature Sensor

pass_temp_curve

Next Steps

The next post will conclude this look at Heat Indicators with examination of visual effects. While temperature and heat transfer cannot be observed directly, there are a number of ways in which firefighters can see the effects of temperature and heat.

Ed Hartin, MS, EFO, MIFireE, CFO

References

Bryner, N., Madrzykowski, D., Stroup, D. (2005). Performance of thermal exposure sensors in personal alert safety system (PASS) devices, NISTR 7294. Retrieved August 19, 2009 from http://www.fire.nist.gov/bfrlpubs/NIST_IR_7294.pdf.

Donnelly, M., Davis, W., Lawson, J., & Selpak, M. (2006). Thermal environment for electronic equipment used by first responders, NIST Technical Note 1474. Retrieved August 19, 2009 from http://www.fire.nist.gov/bfrlpubs/fire06/PDF/f06001.pdf

National Institute of Standards and Technology (NIST) Visualization techniques, Slice animation of a townhouse kitchen fire, [digital video file]. Retrieved August 19, 2009 from http://www.fire.nist.gov/fds4/refs/thouse3/thouse3_slice.avi

Reading the Fire:
Heat Indicators

Thursday, August 13th, 2009

In Reading the Fire: How to Improve Your Skills, I discussed building a concept map of fire behavior indicators as a method to increase competence in reading the fire. Construction of a concept map increases awareness of key indicators and understanding their interrelationships. I am working through this process along with you, with the latest revision to my concept map. Thus far, I have examined Building Factors, Smoke Indicators, and Air Track Indicators, the first three categories in the B-SAHF (Building, Smoke, Air Track, Heat, and Flame) organizing scheme. For review of the discussion of the work done so far, see the following Reading the Fire posts:

Focus Question

The process of developing or refining a concept map identifying fire behavior indicators (FBI) and their interrelationships starts with the following focus question:

What building, smoke, air track, heat, and flame indicators
provide clues to current and potential fire behavior?

As you develop the heat indicators concept map it is likely that you will uncover potential additions to the Building Factors, Smoke, or Air Track Indicators concept maps. You may also identify interrelationships that you may not have thought of previously. Don’t forget to go back and capture these thoughts by adding them to your other maps or placing them in a staging area for further consideration.

Heat and Temperature

Firefighters, like everyone else, have a commonsense understanding of heat and temperature. This is likely where many of our challenges in really understanding thermodynamics begins. The way in which we use the concepts of heat and temperature on a daily basis are likely to be considerably different than they are used in science.

Thermodynamics is a branch of physics that describes processes that involve changes in temperature, transformation of energy, and the relationships between heat and work. Fires and firefighting also involves changes in temperature, transformation of energy, heat and work. “Thermodynamics, like much of the rest of science, takes terms with an everyday meaning and sharpens them – some would say, hijacks them – so that they take on an exact an unambiguous meaning” (Atkins, 2007, p. 3).

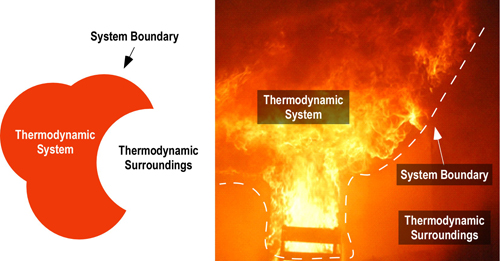
Thermodynamics deals with systems. A thermodynamic system is one that interacts and exchanges energy with the area around it. A system could be as simple as a block of metal or as complex as a compartment fire. Outside the system are its surroundings. The system and its surroundings comprise the universe. For example we might consider a burning fuel package as the system and the compartment as the surroundings. On a larger scale we might consider the building containing the fire as the system and the exterior environment as the surroundings.

Figure 1. Thermodynamic Systems

thermodynamic_system

In a compartment fire, energy is exchanged within the thermodynamic system and between the system and its surroundings.

Energy is the ability to do mechanical work or transfer thermal energy from one object to another. Energy can only be measured on the basis of its effects. There are basically two kinds of energy, kinetic and potential. Potential energy is that which is stored and may be released at a later time. The chemical energy contained in fuel that can be released during combustion is one example of potential energy. Kinetic energy is associated with motion of an object. Movement of molecules when heated during combustion is a good example of kinetic energy. Temperature is a measure of average kinetic energy.

The word flow is often used in discussing heat transfer (e.g., energy flows from materials with higher temperature to those with lower temperature). This helps visualize patterns of movement, but it is important to remember that neither energy nor heat is a fluid. Heat is the process of energy transfer due to temperature differences.

It is important to remember that we cannot see energy, temperature, or heat. However, we can see and feel the impact of increases in temperature as a result of heat (energy transfer). Use of the word heat to describe this category of indicators is appropriate as these indicators are all related to transfer of energy within and out of the compartment fires thermodynamic system.

Getting Started

When reading the fire it is important not to focus on a single indicator or category of indicators. In the case of heat, there are many interrelationships with air track and flame indicators. In some cases, it is arguable whether an indicator belongs in one category or the other (likely it is not important as long as you recognize the interrelationships).

As always in developing a concept map it is important to move from general concepts to those that are more specific. Heat Indicators can be divided into two basic categories, those that you can see (visual effects) and those that you can feel (tactile effects) as illustrated in Figure 2. However, you may choose to approach this somewhat differently.

Figure 2. Basic Heat Indicators

heat_indicators_5-2-2

Developing the Detail

Expanding the map requires identification of additional detail for each of the fundamental concepts. If an idea appears to be obviously related to one of the concepts already on the map, go ahead and add it. If you are unsure of where it might go, but it seems important, list it off to the side in a staging area for possible additions. Download a printer friendly version of Heat Indicators to use as a starting point for this process.

Next Steps

Remember that the process of contracting your own map is likely as important as the (never quite) finished product. The following steps may help you expand and refine the building factors segment of the map:

  • Look at each of the subcategories individually and brainstorm additional detail. This works best if you collaborate with others.
  • Have a look at the following video clip using your partially completed map and notes as a guide to identifying important heat indicators. While this video clip is of conditions inside a compartment, also think about how this fire would present if viewed from the exterior.

The following video clip illustrates a recreation of the Station Night Club Fire that occurred in Rhode Island in 2003 that was conducted at the National Institute of Standards and Technology (NIST) laboratory in Gaithersburg, MD

The next post in this series will discuss visual and tactile heat indicators in greater depth and examine the increasing influence of technology in our perception (and misperception) of developing fire conditions.

Ed Hartin, MS, EFO, MIFireE, CFO

References

Atkins, P. (2000). Four laws that drive the universe. Oxford, UK: Oxford University Press

Reading the Fire
Air Track Indicators Part 2

Monday, August 3rd, 2009

Air track includes factors related to the movement of smoke out of the compartment or building and the movement of air into the fire. Air track is caused by pressure differentials inside and outside the compartment and by gravity current (differences in density between the hot smoke and cooler air). Air track indicators include velocity, turbulence, direction, and movement of the hot gas layer.

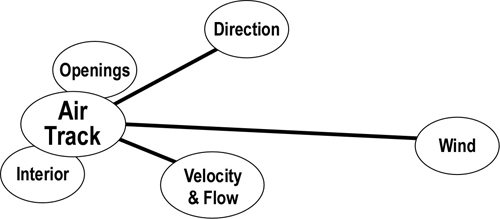
My prior post, Reading the Fire: Air Track Indicators began the process of developing or refining an existing concept map of air track indicators. It is important to evaluate air track at openings and on the interior of the structure. As a starting point, I have identified direction, velocity & flow, and wind as basic air track indicator categories (see Figure 1). However, you may choose to approach this somewhat differently.

Figure 1. Basic Air Track Indicators

air_track_indicators_5-2-2

Air track indicators provide critical cues related to stages of fire development, burning regime, and potential for fire spread. However, it is essential that assessment of air track be integrated with other categories of indicators in the B-SAHF scheme to gain a clearer sense of fire conditions and likely fire behavior. Remember that looking at air track alone may be misleading.

Air Track at Openings and on the Interior

Discharge of smoke at openings and potential openings (Building Factors) is likely the most obvious indicator of air track while lack of smoke discharge may be a less obvious, but potentially important sign of inward movement of air.

Observation and interpretation of smoke and air movement at openings is an essential part of air track assessment, but it must not stop there. Movement of smoke and air on the interior can also provide important information regarding fire behavior.

The path taken by the air track will define the direction of fire spread and may present a significant hazard to firefighters operating between inlet and exhaust openings. This necessitates ongoing assessment of air track from both the exterior and interior of the building.

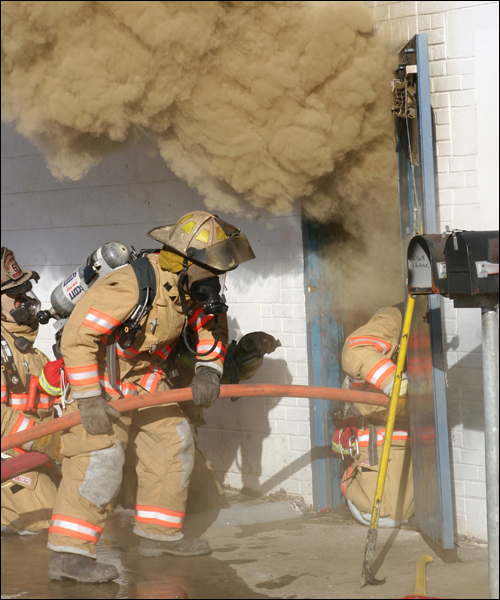
Figure 2. Air Track

air_track_photo

Direction

Consider the following observations. You arrive at a fire in a commercial building and observe smoke showing from a door on floor 1 (Figure 2).

The smoke discharge fills the upper half of the door while it appears that air is moving in the bottom half of the door. What can you infer from this? What would you infer if the smoke discharge completely filled the door?

The direction of the air track can also provide valuable cues to fire behavior. When air moves in an opening (inlet) without any smoke discharge, it is likely that smoke is exiting from another opening (exhaust). When this condition is reversed, and smoke comes out with not inward movement of air, it is likely that another opening is serving as an inlet. When the air track is bi-directional and air moves in at the bottom and smoke moves out at the top, this may be the only opening in the compartment or ventilation from other exhaust openings may be inadequate. In any case where smoke is discharging through an opening, the fire is likely moving in that direction.

Mixing of smoke and air occurs at the interface between the hot gas layer and cooler air below. This is a critical factor in creating the conditions required for backdraft and many types of fire gas ignitions. Pulsing air track, outward movement of smoke followed by an inward movement of air is indicative of an underventlated fire and potential backdraft conditions (consider other indicators in determining if backdraft conditions are likely to exist). It is critical to remember that these pulsations can vary in duration and that backdraft does not generally occur immediately upon making an opening. The time between making an opening and occurrence of a backdraft is dependent on many factors including distance of the compartment with backdraft conditions from the opening. Air track is an extremely useful indicator, but it must be integrated with a big picture evaluation of fire behavior indicators.

Location of inlet and exhaust openings (particularly if they are on different levels or if impacted by wind) is an important Building Factor that directly impacts air track. This is an excellent example of why each of the categories of fire behavior indicators (FBI) must be considered together when reading the fire.

Velocity & Flow

Velocity and flow are two interrelated air track factors. Velocity refers to the speed of smoke and air movement. However, the speed with which smoke is traveling (either out of an opening in the compartment or building or within a compartment) must be considered in relation to the size of an opening or conduit. Flow may be either smooth (laminar) or turbulent. This is dependent to a large extent on velocity. High velocity generally results in turbulent flow through a compartment (such as a hallway) or out an opening (e.g., doorway or window). For a given volume, velocity and turbulence will be higher through smaller openings). High velocity smoke discharge and turbulent flow is generally indicative of high temperature within the compartment (another connection, in this case between air track and heat).

Wind

Wind can influence smoke movement on the exterior of a building (in some cases masking exterior air track indicators) or it can have a more direct influence on air track. As discussed in a number of earlier posts, wind can have a significant influence on compartment fire behavior.

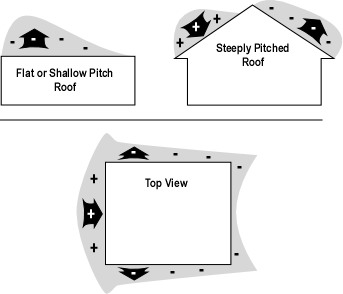
Understanding the potential influence of wind on fire behavior, provides a basis to read and interpret air track indicators. Wind exerts pressure on structural surfaces (see Figure 3), which under fire conditions can have a significant influence on movement of both smoke and air.

Figure 3. Distribution of Pressure due to Wind

pressure_effects

Note. Adapted from Fire Ventilation (p. 34-35) by Stefan Svensson, 2000, Karlstad,Sweden: Räddnings Verket. Copyright 2000 by Stefan Svensson & Räddnings Verket.

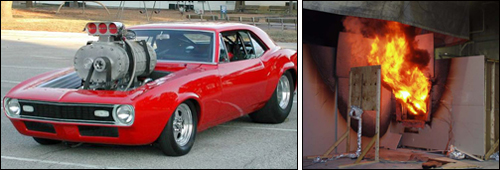
Wind on an inlet opening can act much the same as a supercharger, dramatically increasing heat release rate, fire intensity, and rate of spread (see Figure 4).

Figure 4. Wind Effects

wind_effects

Movement of the Hot Gas Layer

Horizontal movement of the hot gas layer and turbulence at the interface between smoke and clear air below indicate air track direction. As discussed in Reading the Fire: Smoke Indicators height of the hot gas layer is a significant indicator of fire conditions. Even more important than the height of the hot gas layer, are changes in height. A sudden rise could indicate that ventilation has occurred (either performed by firefighters or caused by the fire). Gradual lowering of the hot gas layer could indicate worsening conditions and increased potential for flashover. However, inappropriate or excessive application of water can also cause lowering of the hot gas layer. Sudden lowering could indicate worsening conditions caused by flashover in an adjacent compartment. While not commonly known as a backdraft indicator, raising and lowing of the hot gas layer is similar to a pulsing air track observed at an opening (however in this case the compartment is not fully smoke logged, so the expanding and contracting gases cause the bottom of the hot gas layer to move up and down).

Height and more importantly vertical movement of the hot gas layer may be considered as Smoke or Air Track Indicators (a good argument can be made in either case). For now, I have chosen to position these two types of indicator under Smoke, but with linkage to Air Track, but I am considering moving them to Air Track (while maintaining linkage to Smoke Indicators).

Work in Progress

Hopefully we have been working on this project together and you have been developing or refining the air track segment of your fire behavior indicators concept map. My current map is illustrated in Figure 5.

Figure 5. Air Track Indicators Concept Map v5.2.2.1

air_track_indicators_5-2-2-1

You can also download a printer friendly version of the Air Track Indicators Concept Map v5.2.2.1 (including notes made during development). As indicated by the significant number of notes in the Staging Area of the printer friendly version, a bit more work remains to be done before integrating the Smoke and Air Track indicators in the complete version of the Fire Behavior Indicators Concept Map. Should you have any suggestions or feedback, please post a comment!

Ed Hartin, MS, EFO, MIFireE, CFO

References

Svensson, S. (2000). Fire ventilation. Karlstad, Sweden: Räddnings Verket.

Reading the Fire:
Air Track Indicators

Monday, July 27th, 2009

In Reading the Fire: How to Improve Your Skills, I discussed building a concept map fire of behavior indicators as a method to increase competence in reading the fire. Construction of a concept map increases awareness of key indicators and understanding their interrelationships. I am working through this process along with you, with the latest revision to my concept map. Thus far, I have examined Building Factors and Smoke Indicators; the first two categories in the B-SAHF (Building, Smoke, Air Track, Heat, and Flame) organizing scheme. For review of the discussion of building factors and smoke indicators see the following Reading the Fire posts:

Focus Question

Developing a concept map starts with a focus question that specifies the problem or issue that the map is intended to help resolve. Developing or refining a concept map identifying fire behavior indicators (FBI) and their interrelationships starts with the following focus question:

What building, smoke, air track, heat, and flame indicators
provide clues to current and potential fire behavior?

As you work through this process it is likely that you will uncover additional concepts that may be added to the Building Factors or Smoke Indicators concept maps. You may also identify interrelationships that you may not have thought of previously. Don’t forget to go back and capture these thoughts as you work on the air track map.

Air Track

In Reading the Fire: Smoke Indicators, I defined the difference between Smoke and Air Track indicators. However, it may be useful to revisit the difference between these two categories before engaging in a detailed look at Air Track indicators.

Smoke: What does the smoke look like and where is it coming from? This indicator can be extremely useful in determining the location and extent of the fire. Smoke indicators may be visible on the exterior as well as inside the building. Don’t forget that size-up and dynamic risk assessment must continue after you have made entry!

Air Track: Related to smoke, air track is the movement of both smoke (generally out from the fire area) and air (generally in towards the fire area). Observation of air track starts from the exterior but becomes more critical when making entry. What does the air track look like at the door? Air track continues to be significant when you are working on the interior.

While these two sets of indicators are interrelated, they are considered separately as air track relates to movement of both smoke and air.

Getting Started

When reading the fire it is important not to focus on a single indicator or category of indicators. However, Air Track indicators often provide critical information about stages of fire development, burning regime, differences in conditions throughout the building, and direction of fire spread.

As always in developing a concept map it is important to move from general concepts to those that are more specific. Air Track must be considered at openings and inside the building. Basic indicators include direction, velocity & flow, and wind (as a major influence or modifying factor) as illustrated in Figure 1. However, you may choose to approach this somewhat differently.

Figure 1. Basic Air Track Indicators

air_track_indicators_5-2-2

Developing the Detail

Expanding the map requires identification of additional detail for each of the fundamental concepts. If an idea appears to be obviously related to one of the concepts already on the map, go ahead and add it. If you are unsure of where it might go, but it seems important, list it off to the side in a staging area for possible additions. Download a printer friendly version of Air Track Indicators to use as a starting point for this process.

Next Steps

Remember that the process of contracting your own map is likely as important as the (never quite) finished product. The following steps may help you expand and refine the Air Track indicators segment of the map:

  • Look at each of the subcategories individually and brainstorm additional detail. This works best if you collaborate with others.
  • Have a look at the following video clip using your partially completed map and notes as a guide to identifying important Air Track indicators. Think about what the Air Track indicators mean and visualize developing fire conditions inside the building.

The following video has some excellent Air Track indicators that may aid in developing and refining your Smoke Indicators concept map.

It may also be useful to go back and look at the video from Reading the Fire: Building Factors Part 2 or Reading the Fire: Smoke Indicators and focus in on Air Track Indicators.

Step Back and Look at the Entire Picture

Take this opportunity to engage with the rest of the B-SAHF indicators. Download and print the B-SAHF Worksheet. Consider the information provided in each of the short video clips and complete the worksheet for each. First, describe what you observe in terms of the Building, Smoke, Air Track, Heat, and Flame Indicators and then answer the following five standard questions?

  1. What additional information would you like to have? How could you obtain it?
  2. What stage(s) of development is the fire likely to be in (incipient, growth, fully developed, or decay)?
  3. What burning regime is the fire in (fuel controlled or ventilation controlled)?
  4. What conditions would you expect to find inside this building?
  5. How would you expect the fire to develop over the next two to three minutes?

Twitter

While I believe that Twitter has tremendous potential for quickly sharing information and building a community of practice, the plug-in that I have been using to integrate Twitter with the CFBT-US Blog has resulted in posts being cluttered with a tremendous amount of spam. I have disabled the plug-in, but will continue to provide updates on breaking news and information via Twitter. Follow edhartin on Twitter!

Ed Hartin, MS, EFO, MIFireE, CFO

Reading the Fire:
Smoke Indicators Part 2

Monday, July 20th, 2009

In many cases, smoke may provide the dominant indication that there is a fire in the building (but keep in mind that if you can see smoke on the exterior, there are also air track indicators). Have a look at Figure 1 and see what smoke indicators you observe.

Figure 1. Smoke Indicators

ranlo_c-fire_1

Note: Terry Moody Photo, Commercial Fire Ranlo, NC.

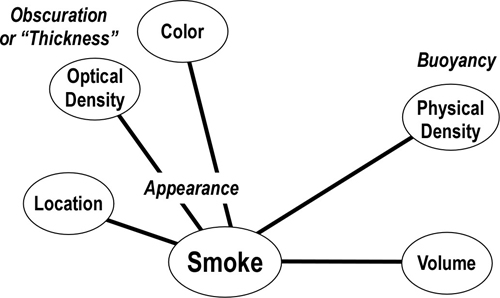
My prior post, Reading the Fire: Smoke Indicators began the process of developing or refining an existing concept map of smoke indicators. As a starting point, I have identified location, optical density (thickness), color, physical density (buoyancy), and volume as basic categories of smoke indicators (see Figure 2). However, you may choose to approach this somewhat differently.

Figure 2. Basic Categories of Smoke Indicators

smoke_indicators_5-2-2

These five categories provide a simple framework for examining smoke indicators, but considerably more detail may be developed within each category. Observation of smoke indicators can often provide an indication of the location and extent of the fire as well as its burning regime. However, it is essential that smoke indicators be integrated with other categories of indicators in the B-SAHF scheme to gain a clearer sense of fire conditions and likely fire behavior. Remember that looking at smoke alone may be misleading.

Location

The concept of smoke location applies to both the exterior and interior of the structure. From the exterior, consider the following:

  • Is smoke visible (this one is simple)?
  • What side(s) and level(s) of the building is the smoke visible from?
  • Is the smoke discharge from substantial openings such as open windows or doors?
  • Is smoke discharge limited to a single opening or is it visible from multiple openings?
  • Is the smoke discharge from points of normal building leakage (e.g., gaps around windows and doors, normal ventilation openings such as attic vents)?
  • Does the location of smoke discharge change over time?

These questions identify potential linkage to building factors indicators (i.e., actual openings) and air track (discharge of smoke and intake of air). Location may also be interrelated with other smoke indicators such as volume. For example, discharge of smoke from the top of a doorway has considerably different implications if the ceiling height is 7.3 m (24′) rather than 2.4 m (8′).

  • Smoke location continues to be important on the interior of the building.
  • Is smoke confined to a single compartment or group of compartments?
  • Is smoke present in void spaces?
  • Is smoke on one level or multiple levels?
  • Are there changes to the location of smoke over time?

Some indicators can be classified into more than one category. For example, smoke at the ceiling level could be considered from the perspective of location or (potentially more importantly) as an indicator of volume.

Volume

The language used to describe fire and smoke conditions in radio communications (e.g, size-up report or report on conditions) is often subjective and ambiguous. For example, what exactly is heavy smoke and how is that different from light smoke. I gained a new appreciation of the ambiguity of these terms when teaching fire officers who had English as a second or third language. Heavy and light commonly refer to weight, but in this case are frequently applied to volume or possibly optical density (or in other cases both of these characteristics). In an effort to provide clarity, I use the terms large and small in relation to volume. Note that this is still subjective, but I think a bit clearer than heavy and light.

From the exterior, consider the volume of smoke discharged. However, it is important to keep in mind that this may not be an indication of how much smoke is in the building. Volume becomes a bit more complex, but more important inside the building. The level of the neutral pressure plane at openings is related to both volume and air track. After entering a compartment, the level of the hot gas layer is a key indicator of smoke volume, but it must be considered in relation to building factor such as ceiling height. Firefighters often consider the height of the hot gas layer above the floor, but may not consider the depth of the hot gas layer down from the ceiling (which is equally important as an indicator of smoke volume). Compartments that are completely filled with smoke are said to be smoke logged. As with other indicators, it is essential to consider changes over time. In particular:

  • Is the volume of smoke discharged from the exterior increasing or decreasing?
  • Is the level of the neutral plane or hot gas layer raising or lowering?

Movement of the hot gas layer can indicate changes in volume or air track, both of which are important indicators of changing fire conditions, burning regime, and potential for extreme fire behavior such as ventilation induced flashover or backdraft.

Optical Density (Thickness)

As with the earlier discussion of heavy and light smoke, density can be a bit confusing as it is used in two different contexts. Most commonly, dense smoke is so thick that you can’t easily see through it. Optical density refers to obscuration, how difficult it is to see through the smoke. Thick or optically dense smoke contains a high concentration of particulates and is difficult to see through. High particulate concentration can also give the smoke the appearance of having texture (like velvet). Thickness is influenced by burning regime and the type of fuel that is burning. Ventilation controlled conditions and/or combustion of many synthetic fuels can result in development of optically dense or thick smoke.

  • How thick is the smoke on the exterior of the structure?
  • How thick is the smoke inside the building?
  • Does thickness differ based on location (a potential connection with location indicators here)?
  • Is thickness changing over time?

A key indicator substantively related to thickness is texture. Increased particulate concentration, increases obscuration, but if sufficiently high, also results in the appearance of texture. Smoke that looks like velvet is the result of extremely inefficient combustion and contains a high concentration of unburned fuel.

Color

Color has traditionally been an important but often misunderstood smoke indicator. Consider the following questions:

  • Which color smoke indicates the greatest hazard to firefighters: Creamy white or light tan, light gray, dark gray, brown, or black?
  • What color smoke indicates potential backdraft: White, yellow, brown, dark gray, or black?

The greatest challenge in making sense of smoke color is that it is the result of a number of interrelated factors including fuel type and burning regime. Light colored (e.g., white to light tan) smoke may contain a high concentration of unburned pyrolizate. While this smoke color is not typically associated with a high degree of hazard, this smoke is fuel and may present a significant threat. Yellowish smoke is typically associated with the backdraft phenomena. However, observation of a number of backdraft events points to considerably less certainty in the relationship between smoke color and backdraft.

Think about the range of smoke color that may be encountered in structural firefighting, but remember that all organic (carbon containing) fuel can produce black smoke under sufficiently ventilation controlled conditions.

Changes in color over time are a critical indicator of developing fire conditions and the effect of tactical operations.

In the early 1980s when my eldest daughter was five or six years old, she was observing live fire training in an acquired structure. During one evolution, she pointed out smoke conditions at a second floor window to a photographer who was taking pictures for a National Fire Protection Association (NFPA) training program. She stated “you see that light gray smoke coming from the window…it’s going to get black and then flames will come out”. Sure enough that was exactly what happened. The photographer was surprised. I was not. I pointed out that Heather had been to more fires than the photographer and that children pay attention to everything. There is a lesson here for us!

Physical Density (Buoyancy)

From a scientific perspective, density is mass per unit volume. Vapor density is the relative density of a gas or vapor in comparison to air (at standard temperature and pressure). The fire environment adds some complexity as increasing the temperature of a gas can cause it to expand, reducing its density (which is why hot smoke goes up). However, most of the constituents of smoke are heavier than air and will sink as they cool. Physical density refers to the buoyancy of the smoke.

Smoke that is buoyant will rise quickly and smoke that is not will hang low to the ground. Generally buoyancy is related to the temperature of the smoke, the higher the temperature, the less (physically) dense the smoke and the greater the buoyancy. Early in fire development smoke may not be that buoyant due to limited heat release. Development of a well defined hot gas layer indicates significant difference in temperature between the hot smoke and cooler air below. Later in the development of the fire, buoyancy may be affected by the operation of automatic sprinklers (or application of water from hoselines) or it may simply cool as it moves away from the fire. In evaluating the importance of physical density, consider the following questions:

  • What building factors might impact on buoyancy?
  • How does ambient temperature influence buoyancy?
  • What potential hazards does smoke with limited buoyancy (i.e., cool smoke) present?

Work in Progress

Hopefully we have been working on this project together and you have been developing or refining the smoke segment of your fire behavior indicators concept map. My current map is illustrated in Figure 3.

Figure 3. Smoke Indicators Concept Map v5.2.2.1

smoke_indicators_5-2-2-1

You can also download a printer friendly version of the Smoke Indicators Concept Map v5.2.2.1 (including notes made during development). As always, feedback is greatly appreciated.

Master Your Craft

Ed Hartin, MS, EFO, MIFireE, CFO