Reading the Fire:
Heat Part 3
Thursday, August 27th, 2009
Reading the Fire Heat Indicators briefly examined energy, temperature, and heat in thermodynamic systems, and introduced the two major categories of heat related fire behavior indicators: those that we can see (visual) and others that can be felt (tactile) as illustrated in Figure 1.
Figure 1. Basic Heat Indicator Categories
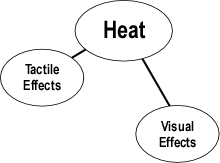
Heat Indicators Part 2 elaborated on tactile effects. This post will examine visual effects and provide an expanded heat indicators concept map.
Remember that as with each of the B-SAHF (building, smoke, air track, heat, and flame) indicators; it is essential that assessment of heat is integrated with other elements of the B-SAHF scheme to gain a clearer sense of fire conditions and likely fire behavior.
Visual Effects
Air track often provides an early heat indicator. Observation of turbulent smoke pushing from the building at high velocity is a reliable indicator of a tremendous amount of heat energy and high temperatures inside the structure.
Figure 2. Air Track as a Heat Indicator
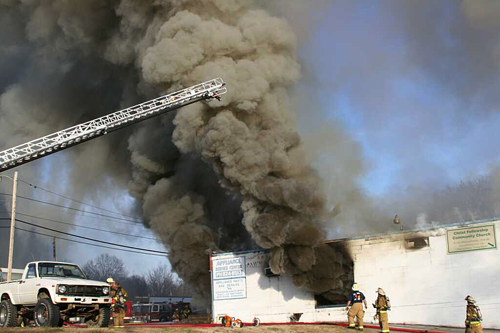
Note: Photo by Terry Moody, Ranlo NC.
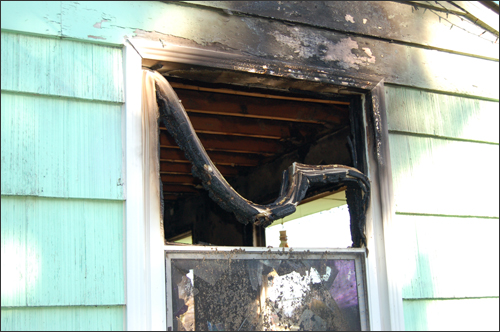
Some visual indicators can be observed from the exterior such as bubbling paint, melting or softening roofing material, crazing glass, and condensation of pyrolyzate on windows. High temperature (and in some cases, not so high temperature) can have a more dramatic effect (see Figure 3). This vinyl frame window failed due to heat resulting from a fully developed fire inside the compartment.
Figure 3. Temperature Effects on Building Materials
Note: Photo by Ed Hartin
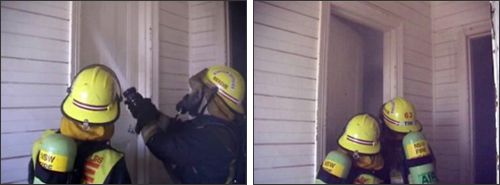
Fire stream effects such as evaporation of water from a hot surface (such as a door) or lack of return from a temperature check (brief application of water fog into the hot gas layer to check overhead temperature) also provide an indication of temperature (Figure 4)
Figure 4. Checking the Door and Temperature Check
Note: Photo by John McDonough
A thermal imaging camera (TIC) provides a highly effective means for visualizing temperature differences (see Figure 5). Use of a TIC should begin on the exterior and continue during interior operations.
Figure 5. Thermal Image
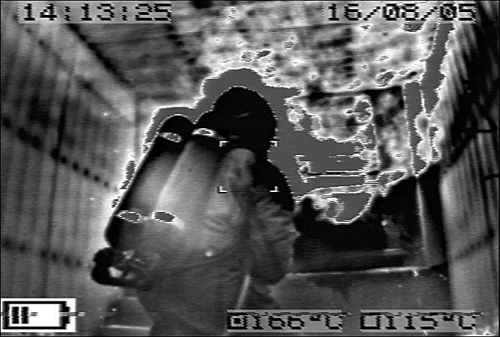
Note: Photo provided by Stefan Svensson
Despite the tremendous advantage provided by use of a TIC, it is essential to be mindful of the limitations of this technology. Thermal images only identify the temperature differences that are in direct line-of-sight. Insulating materials such as compartment linings can prevent the TIC from identifying fire conditions outside the compartment (e.g., floor below, ceiling void). In tests of floor and roof assemblies conducted by the Underwriters Laboratory (UL), thermal imaging cameras were unable to detect a fully developed fire below a typical wood floor (see Figure 6). The floor in Figure 6 consisted of an engineered system of I-joists, sub-floor, finished floor, carpet padding, and carpet. The floor system was being tested over a 14′ x 17′ (4.27 m x 5.18 m) gas fired furnace in accordance with ASTM E119. While the temperature indicated by the TIC is 80.1o F (27o C), the highest temperature measured by thermocouples on the structural members was in excess of 1341o F (727o C). It is essential to integrate thermal image data with direct visual observations to obtain a more complete picture of temperature conditions.
Figure 6. UL Floor Systems Test
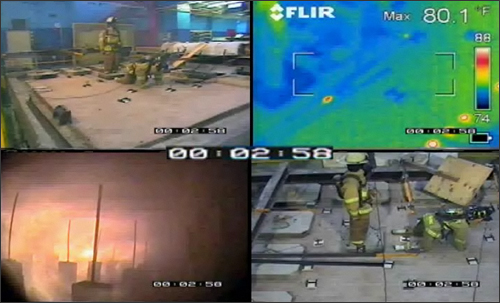
Adapted from Underwriters Laboratory Structural Stability of Engineered Lumber in Fire Conditions [on-line training program]
The tests of engineered lumber systems and training program developed by UL provide excellent information on performance of these structural materials under fire conditions. This program as well as on-line training on fire behavior in single family dwellings and fire modeling are available free of charge from UL University.
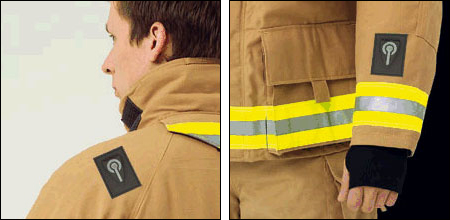
Technological advancements also include temperature sensing integrated into breathing apparatus, personal alert safety systems (PASS), and even protective clothing (see Figure 7) to assist firefighters in recognizing dangerous elevated temperatures and in some cases telemetry to transmit this information to others, outside the hazardous environment. This could be viewed as a visual indicator (based on visual display of the information) or as augmentation of tactile indicators.
Figure 7. Smart Clothing by Viking Industries
Work in Progress
Hopefully we have been working on this project together and you have been developing or refining the air track segment of your fire behavior indicators concept map. My current map is illustrated in Figure 8.
Figure 8. Heat Indicators Concept Map v5.2.2.1
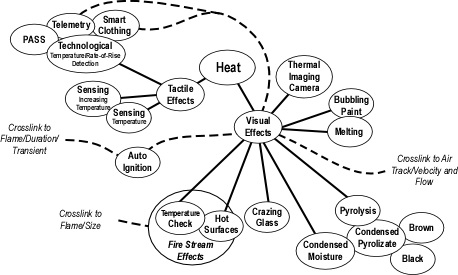
You can also download a printer friendly version of the Heat Indicators Concept Map v5.2.2.1 As always, should you have any suggestions or feedback, please post a comment!
Ed Hartin, MS, EFO, MIFireE, CFO
References
Underwriters Laboratory. (2009). Structural Stability of Engineered Lumber in Fire Conditions [on-line training program]. Retrieved August 27, 2009 from http://www.ul.com/global/eng/pages/offerings/industries/buildingmaterials/fire/courses/structural/


